
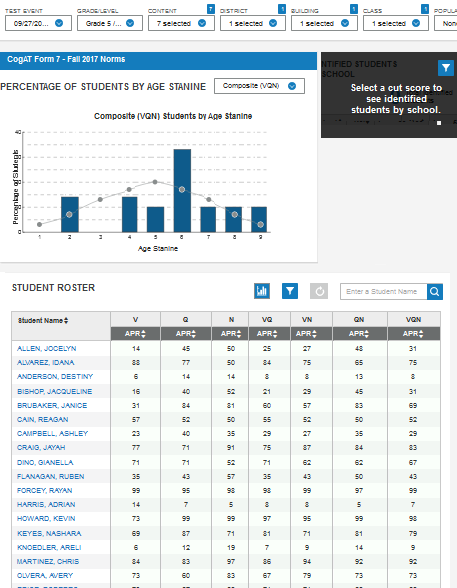
The CogAT dashboard displays student scores in ways uniquely suited to the assessment's design and content. The dashboard provides a stanine—standardized to nine levels—scale as a line graph for the normative sample of 2017 superimposed over a bar graph of actual results of your student scores.
Student scores, and the patterns they exhibit, provide educators with evaluative tools (called Ability Profiles) that help guide them toward effective group instruction by applying CogAT Differentiated Instruction Reports.
Learn more about the CogAT dashboard layout.
Learn more about the applications of CogAT assessments to Ability Profiles and instructional opportunities.