The Student Roster provides scores by test and composite or by skill domain and cognitive level for each student in the selected group. The top of each page of the Student Roster provides the report scope and test information, including some or all of the following: assessment, form, test date, norms, grade, level, location, and the total number of students tested.
Within the report, the first column of each row contains a student's name, ID number, secondary student ID (if applicable), birth date, age, program, level, form, administration mode, gender, and administrator code (if applicable). The remaining columns in the row provide the student's scores for each test and composite or skill domain and cognitive level.
You can click a student's name within the report to open the profile for that student.
Note: Student Rosters display a maximum of 25 students per page.
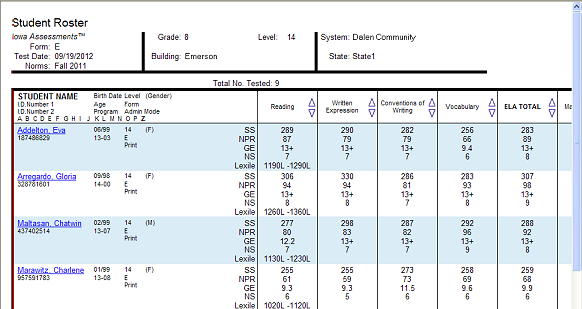
Note: Data in this sample are for illustrative purposes only.
Student Roster Item Response Record (Riverside Interim Assessments only)
The web display version of the Student Roster Item Response Record is a multi-page report that identifies the test items used to measure each skill domain and provides student responses for each of these test items. Each selected skill domain is provided on a separate page of the report. The top of each page of the report provides the report scope and test information, including some or all of the following: assessment, form, test date, grade, level, class, building, district (if applicable), system, region (if applicable), state, and the total number of students tested.
The blue bar at the top of the report table provides the skill domain for which responses are being identified. The first column lists the names of the students in the selected group. The remaining columns provide the test items used to measure the skill domain and each student’s response to those test items. The column header provides the test item number as well as the cognitive level that is measured using this test item. If a student answered a test item correctly, the cell appears blank; if a student answered incorrectly, the student’s test response is provided. No response is identified as a zero (0), and a multiple response is displayed as an asterisk (*).
Note: Student Rosters display a maximum of 25 students per page.
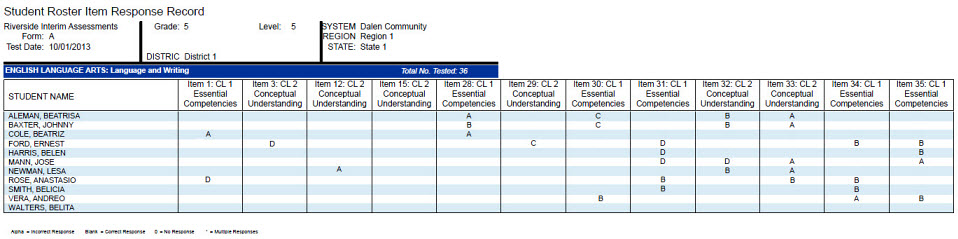
Note: This report is also available as an Excel ® export file. To download as an Excel file, select the Export to Excel option when creating the report.
The following table applies to both Iowa and Logramos.
Field |
Selections |
Description |
|
GRADE/LEVEL |
Iowa: grades K - 12 and corresponding levels Logramos: grades K - 8 and corresponding levels |
Any listed combination of grade, test level, and, if available, subject or battery. Only those grades and levels that were tested are available for selection. |
|
LEVEL OF ANALYSIS
|
|
TC analyzes scores by test and composite; selecting this creates the Composite Calculation Options field. SD analyzes scores by skill domains and cognitive levels; selecting this creates the SKILL DOMAIN CLASSIFICATION field. |
|
SKILL DOMAIN CLASSIFICATION (Skill Domain Analysis only) |
Select 1 from the available for: Iowa
Logramos
|
Determines which classification domain (for example, Common Core State Standards) is used to define and group skills. Impacts SUB CONTENT SCOPE options below. |
|
SCORE(S) |
For Test and Composite Analysis (TC), select up to 5:
For Skill Domain Analysis (SD), select up to 3:
|
Differs TC to SD. Click a LEVEL OF ANALYSIS heading in the center column to view your options.
See SCORE FILTERS below for instructions on how to restrict results by score or score range.
For more information on scores, see Score Descriptions for Iowa or Logramos.
*NPR: A percentile rank indicating the status or relative rank of a student/
**GE: A decimal number that describes a student’s location on an achievement continuum in terms of grade and months at which the typical student received this score (for example, 2.2 is second grade and two months into that grade)
***SS: A number that describes a student’s location on an achievement continuum with the scale based on the Iowa Assessments test subjects growth model
****NS: A stanine indicating the status or relative rank of a student’s score compared with a nationally representative sample of examinees |
|
Click to select or clear any of the following scoring factors available for this report.
Include Students Coded in Office Use: Refers to the "Office Use Only" section of a student answer document. Identifies students whose test scores should be included or excluded from group averages.
|
|||
CONTENT SCOPE |
1 or more of the following:
|
Select one or more to view targeted skills on the report. (You may not see all of the selections listed here, depending on your previous selections for Assessment, LEVEL OF ANALYSIS, and GRADE/LEVEL.) |
|
SUB CONTENT SCOPE (Skill Domain Analysis only) |
Varies by previous selections. |
A list of target areas to display on the report, derived from the previous SKILL DOMAIN CLASSIFICATION and CONTENT SCOPE selections as well as GRADE/LEVEL. |
|
REGION/SYSTEM/DISTRICT/ BUILDING/CLASS |
|
Determines the population scope of your report. The field name depends on your setup and permissions (for example, BUILDING if you are a Building or School Administrator). If you select a specific location, a new sub-level field opens below. This continues for all available locations (down to the level of CLASS). |
|
POPULATION FILTERS |
4 categories, 1 selection allowed for each.
|
Narrows results by gender, ethnicity, program (such as IEP or Gifted), and/or administrative code. |
|
SCORE FILTERS |
Narrows results based on score and content area. |
||
SCORE WARNING / INDICATOR FILTERS |
Narrows results by a particular score warning message or indicator. |
Score Filters
a. For the SCORE FILTERS field, click Change. The filter box appears with filter options available for the report. These options vary depending on the type of report.
b. In the SCORE list, select the specific score type to use as a filter for the test results.
Note: Lexile is not available for filtering because it is represented by a range.
c. In the CONTENT AREA list, select one of the skill domains.
d. Select a relational operator (is equal to, is greater than, for example) from the COMPARISON list and type a VALUE in the box.
e. (Optional) Specify one or two additional filters by selecting AND or OR in the AND/OR list and repeating steps b - d.
Note: Selecting AND adds the additional filter requirement to the previous filter(s); the results contain only those values that meet both filter requirements. (For example: If your filter states “greater than 40 AND less than 50,” then the results include only values between 41 and 49.) Selecting OR includes the additional filter results together with the results of the previous filter(s); the results contain those values that meet either of the filter requirements. (For example: If your filter states “greater than 90 OR less than 10” on a scale of 0 to 99, then the results include values 91 to 99 and values 0 to 9.)
f. Click Apply to apply the filters to the report. To remove or cancel the filter(s), click Cancel.
Score Warning/Indicator Filters
a. For the SCORE WARNING / INDICATOR FILTERS field, click Change. The filter box opens.
b. In the SCORE WARNING / INDICATOR list, select # = Items Attempted/Completion Criteria.
The Include and Exclude buttons appear beside the field. Include is the default value.
c. To show the results by score warning or indicator, leave the Include box selected. To exclude results not matching the criteria, select Exclude.
d. To remove the filter, click Cancel, then Clear Filters on the Create a Report page.