-2.png?height=120&name=image%20(1)-2.png)
Displays one of several types of graphs showing each student's scores reflecting skill domain and cognitive level. Longitudinal and progress monitoring graphs provide measures for tracking student improvements over a period of time.
The following student profile displays are available for the assessments specified in parentheses:
*Cognitive levels provide a hierarchy of critical thinking skills; the three included in the report are Essential Competencies, Conceptual Understanding, and Extended Reasoning.)
Bar Graph
The Student Profile—Bar Graph displays a bar graph of students' scores by test and composite or by skill domain and cognitive level, for each student in the selected group(s). The top of each page of the report provides the report scope and test information, including some or all of the following: the student's name, student ID, assessment, form, test date, norms, grade, level, class, building, district (if applicable), system, region (if applicable), and state.
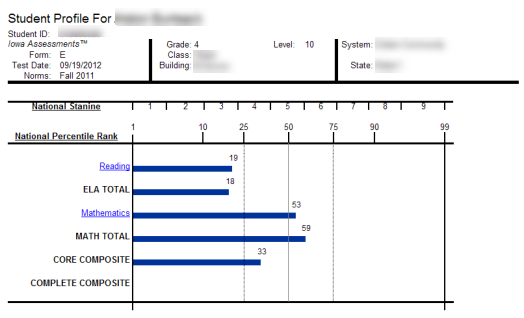
Note: Data in this sample are for illustrative purposes only.
Bar Graph with Confidence Interval (CogAT, GMRT, Iowa, and Logramos)
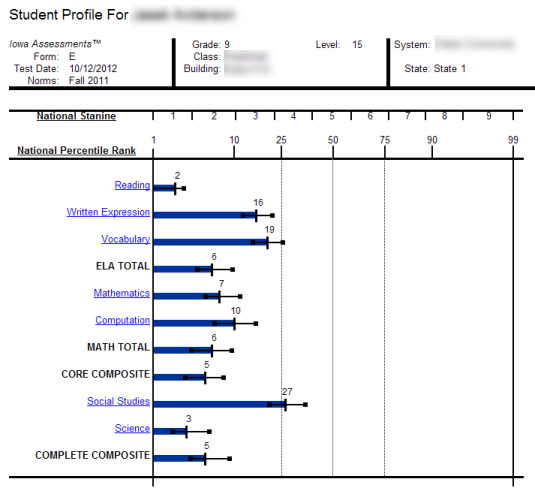
The Student Profile - Bar Graph with Confidence Interval displays a bar graph of students' scores by test and composite or by skill domain and cognitive level, for each student in the selected group(s). The top of each page of the report provides the report scope and test information, including some or all of the following: the student's name, student ID, assessment, form, test date, norms, grade, level, and location with the addition of a confidence interval for each score, which provides a visual representation of the margin of error that may apply to each test score.
This image shows a report for an Iowa Assessments test.
The image below shows a report for GMRT.
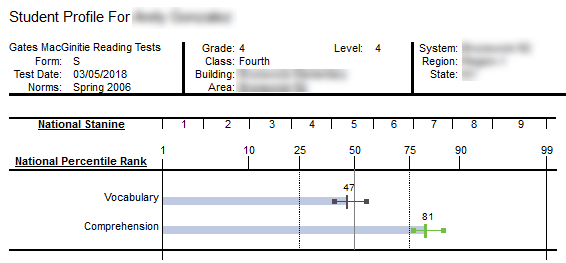
Note: Data in this sample are for illustrative purposes only.
Longitudinal Line Graph (GMRT, Interim Assessments, Iowa, and Logramos)
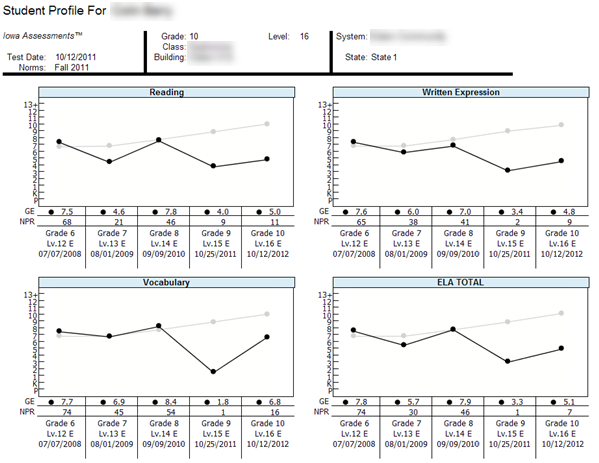
The Student Profile — Longitudinal Line Graph displays a series of line graphs showing a student's test and composite scores over time for up to five test administrations. For comparison purposes, the Iowa Assessments and Logramos graphs also display the growth in achievement for the average student in the nation over the same period of time.
This image shows a report for the Iowa Assessments.
The image below shows a longitudinal report for GMRT.
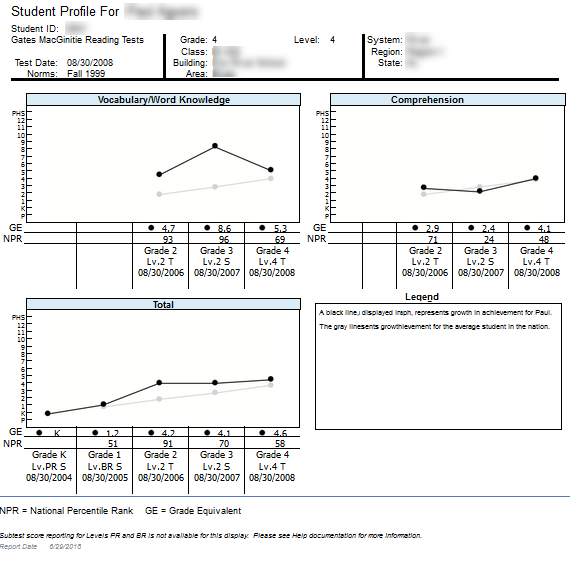
Note: Data in this sample are for illustrative purposes only.
Balanced Assessment Line Graph (Interim and Iowa Assessments).
The Student Profile — Balanced Assessment Line Graph presents results from Iowa Assessments and Riverside Interim Assessments and allows you to set growth goals for a student and track the student's progress over time. The ELA Total or Mathematics Total scores from up to five test administrations are displayed. For each Riverside Interim Assessments test administration, the score is presented as an Estimated Iowa Assessments Standard Score (eSS), which is an estimated score range for the Iowa Assessments derived from the Riverside Interim Assessments results. A blue line indicates the growth goal that you set for the student. The scores for each test administration appear as red or green, indicating that the student is above or below the growth goal, respectively. For comparison purposes, the graphs also display a gray line representing the growth in achievement for the average student in the nation over the same period of time.
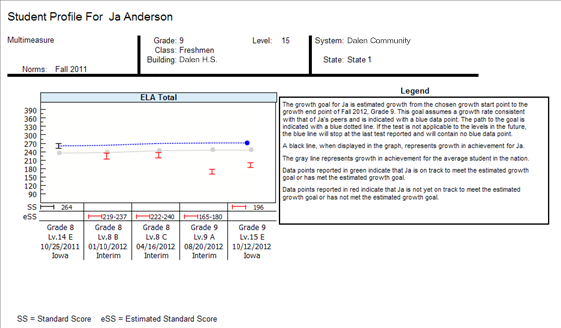
Note: Data in this sample are for illustrative purposes only.
Progress Monitoring Line Graph (Interim Assessments only)
The Student Profile — Progress Monitoring Line Graph allows you to track the progress of a student by skill domain for up to three test administrations taken within the year.
Instructions: Click to open a table with definitions for the remaining fields. When you have entered your report parameters, continue with the next step.
|
Field |
Selections |
Description |
|
|
GRADE/LEVEL |
Grades 2 - 11 and corresponding levels |
Any listed combination of grade, test level, and, if available, subject or battery. Only those grades and levels that were tested are available for selection |
|
|
LEVEL OF ANALYSIS |
|
Test Analysis views students by test score. Skill Domain analyzes scores by skill domains and cognitive levels. Selecting this creates the SKILL DOMAIN CLASSIFICATION field. |
|
|
DISPLAY OPTIONS |
Options are determined by LEVEL OF ANALYSIS selection. Selection determines available selections for SCORE(S) (below). * Creates Test Administrations field below. |
||
|
SKILL DOMAIN CLASSIFICATION |
● Common Core State Standards (default/only option) ● CCR Anchor Standards (applies to ELA only) *CCR: College and Career Readiness for Reading |
Determines which classification domain (for example, Common Core State Standard Domains) is used to define and group skills. |
|
|
SCORE(S) |
1 of the following:
|
Selection for LEVEL OF ANALYSIS and DISPLAY OPTIONS determines available SCORE(S) for the report. For additional information about a field, see descriptions for Interim fields. |
|
|
CONTENT SCOPE |
|
Select one or both, if available, to view targeted skills on the report. |
|
|
SUB CONTENT SCOPE (Skill Domain Analysis only) |
A list of target areas within the CONTENT SCOPE(s) selected in the previous (CONTENT SCOPE) field. |
Options vary by LEVEL OF ANALYSIS, DISPLAY OPTIONS, and GRADE/LEVEL. |
|
|
REGION/SYSTEM/DISTRICT/ BUILDING/CLASS |
|
Determines the population scope of your report. The field name depends on your setup and permissions (for example, BUILDING if you are a Building or School Administrator). If you select a specific location, a new sub-level field opens below. This continues for all available locations (down to the level of CLASS). |
|
|
STUDENT |
|
All runs the report for all students in the location specified in the locations field above. |
|
|
TEST ADMINISTRATIONS |
Select up to four test administrations from the test administrations listed. If multiple assessments exist for a given date, point to the test administration date, and a list of grades/levels opens; select one from each list. |
The list includes the previously selected Test Administration Date, which is set as the end point for the graph. |
|
|
The options below are available only when DISPLAY OPTIONS is set to Balanced Assessment Line Graph. |
|||
|
GROWTH START POINT TYPE |
|
If you select Iowa Assessments, you must select an Iowa Assessments test administration in the Growth Start Point field for the starting point of the growth goal line. If you select GROWTH GOAL, you must select a PR in the GROWTH GOAL field. |
|
|
GROWTH START POINT |
Select an Iowa Assessments test administration date. |
Selection marks the beginning date of the growth goal line. |
|
|
GROWTH END POINT |
Select a season (fall, midyear, or spring) and year. |
Selection marks the end date (season/year) of the growth goal line. |
|
|
GROWTH GOAL |
If your GROWTH START POINT Type is Iowa Assessments, then select one of the following options:
If your GROWTH START POINT TYPE is GROWTH GOAL, then select the PR (from 10th to 99th). |
Selection determines the measure of growth between the start and end points |
|
CCR - College and Career Readiness for Reading
IOWA/Logramos
|
Field |
Selections |
Description |
|
GRADE/LEVEL |
Grades K - 8 and corresponding levels |
Any listed combination of grade, test level, and, if available, subject or battery. Only those grades and levels that were tested are available for selection |
|
LEVEL OF ANALYSIS |
|
TC analyzes scores by test and composite; selecting this creates the Composite Calculation Options field. SD analyzes scores by skill domains and cognitive levels; selecting this creates the SKILL DOMAIN CLASSIFICATION field. |
|
DISPLAY OPTIONS |
|
When LEVEL OF ANALYSIS = Skill Domain Analysis, Bar Graph is the only option for display. Selection determines available selections for SCORE(S) (below). * Creates TEST ADMINISTRATIONS field below; may create additional Growth fields (see below). |
|
SKILL DOMAIN CLASSIFICATION (Skill Domain Analysis only) |
Logramos Domains (default/only option) |
Determines which classification domain (for example, Common Core State Standard Domains) is used to define and group skills. |
|
SCORE(S) (Test and Composite Analysis only) |
Available Scores per DISPLAY OPTIONS |
Selection for DISPLAY OPTIONS determines available SCORE(S) for report. Click your display option (left) to view score(s) you can display in the output. For additional information about a field, see descriptions for Logramos fields. |
|
||
|
Click to select or clear any of the scoring factors that appear for your report.
Include Students Coded in Office Use: Refers to the "Office Use Only" section of a student answer document. Identifies students whose test scores should be included (Overrides exclusions; those test scores marked for exclusion will be used in computing group averages.) or excluded (Test scores marked for exclusion will not be used in computing group averages; those test scores will be reported on individual student score reports) from group averages.
|
||
|
CONTENT SCOPE |
1 or more of the following:
|
Select one or more to view targeted skills on the report. (You may not see all of the selections listed here, depending on your previous selections for Assessment, LEVEL OF ANALYSIS, and GRADE/LEVEL.) |
|
SUB CONTENT SCOPE (Skill Domain Analysis only) |
A list of target areas within the CONTENT SCOPE(s) selected in the previous (CONTENT SCOPE) field. |
Options differ depending on Level and SKILL DOMAIN CLASSIFICATION selections. |
|
REGION/SYSTEM/DISTRICT/ BUILDING/CLASS |
|
Determines the population scope of your report. The field name depends on your setup and permissions (for example, BUILDING if you are a Building or School Administrator). If you select a specific location, a new sublevel field opens below. This continues for all available locations (down to the level of CLASS). |
|
STUDENT |
|
All runs the report for all students in the location specified in the locations field above. |
|
TEST ADMINISTRATIONS |
Select up to four test administrations from the test administrations listed. If multiple assessments exist for a given date, point to the test administration date, and a list of grades/levels opens; select one from each list. |
The list includes the previously selected Test Administration Date, which is set as the end point for the graph. |
|
The options below are available only when the DISPLAY OPTIONS selection is Longitudinal Line Graph and SCORE(S) selection is Standard Score/National Percentile Rank . |
||
|
GROWTH START POINT TYPE |
|
If you select Logramos Assessments, you must select a Logramos Assessments test administration in the GROWTH START POINT field for the starting point of the growth goal line. If you select GROWTH GOAL, you must select a PR in the GROWTH GOAL field. |
|
GROWTH START POINT |
Select a Logramos Assessments test administration date. |
Selection marks the beginning date of the growth goal line. |
|
GROWTH END POINT |
Select a season (fall, midyear, or spring) and year. |
Selection marks the end date (season/year) of the growth goal line. |
|
GROWTH GOAL |
If your GROWTH START POINT TYPEis Logramos Assessments, select If your GROWTH START POINT TYPEis GROWTH GOAL, then select the PR (from 10th to 99th). |
Selection determines the measure of growth between the start and end points. |