
Data Package: Online Testing
Role: Account Holder, Administrator, Teacher, or Digital Resource & Reporting Access
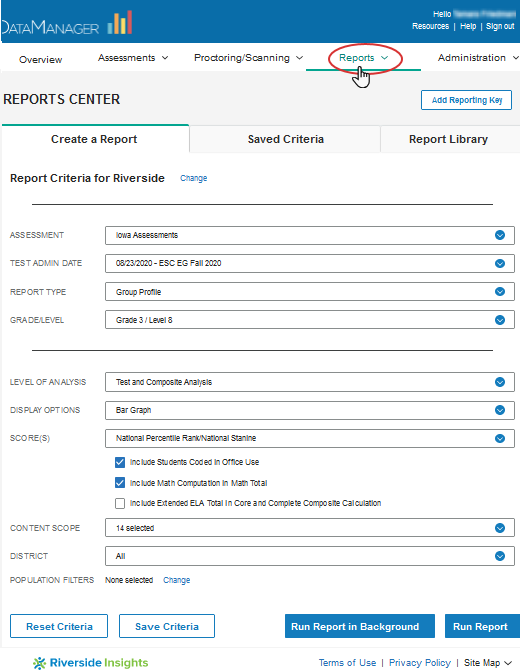
You can specify criteria and run reports on the Create a Report page.
Report options and availability vary according to the following:
- Your role and location. You can create and view reports only for your own location level and those below you.
- The tests that have been administered to students, entered in the database, and marked as completed.
- The options you select as you move down the list of criteria. As you select options, subsequent fields with dependencies on those options may change. (Common fields that produce these changes include REPORT TYPE, LEVEL OF ANALYSIS, and DISPLAY OPTIONS.) When this happens, the page reloads to display new or adjusted fields.
To create an Interim Assessments report:
1. Open the Create a Report tab in the Reports Center by doing one of the following:
- If you are a Teacher, Administrator, or above, click the Reports menu at the top of the page at any point after signing in. Select Classic if provided a drop-down option.

Note: If your institution has purchased CogAT you will also see the option to select the CogAT Dashboard. For instructions on these options, see the related dashboard overview sections.
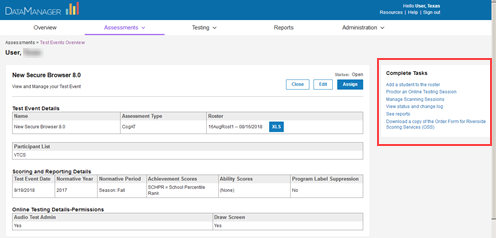
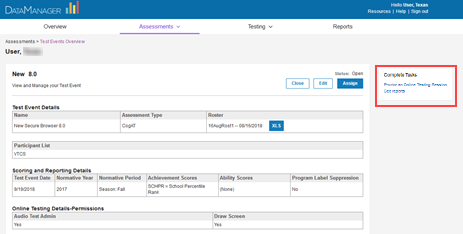
- For individuals with Teacher roles and above, you can also open the Create a Report tab from the Test Events Overview page by clicking See reports in the Complete Tasks box.
Test Events Overview: Admin View
Test Events Overview: Teacher View
- For reports-only access users with a web Reporting Key, create your account or sign in to your existing account and enter the Reporting Key provided by your school or district administrator.
Note: If you have access to multiple locations, enter each new Reporting Key once. Subsequently, you can select the location from a Select Report Criteria for drop-down list at the top of the Create a Report tab.
2. In the ASSESSMENT list, select the test your students took. If there is more than one option, select the one for which you want to run a report.
3. From the TEST ADMIN DATE list, select your test event if different from the default. Test events are indicated by their date and name. They are sorted by date, most recent first.
4. In the REPORT TYPE list, select the report you want to produce. Short descriptions for each report are provided below, along with links to fuller descriptions with samples.
Note: Reports and fields are listed here in the same order as they appear on your DataManager platform.
Data Export
Available to users with Account Holder and Administrator roles only. Provides a file in a standard or custom template containing data on test results.
-
Data Export files are available to users with Account Holder or Administrator roles.
These files contain data for a test event and can be exported as .txt files in the following formats:
-
- ASCII Fixed-Width
- ASCII Tab-Delimited
- ASCII Comma-Delimited
- ASCII Pipe-Delimited.
The data is available to be downloaded after a report has been run. To do this, click the link on the report page as shown below.
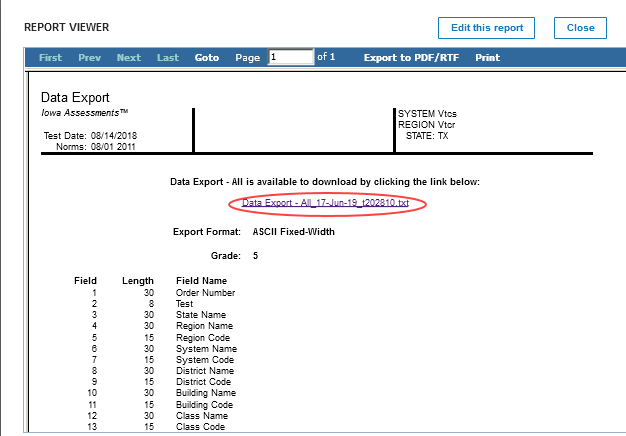
When you create a Data Export file, you can choose to export it using a standard or a custom format.
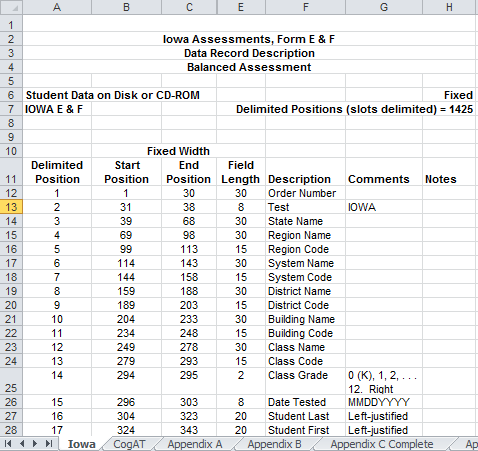
The standard format, shown below, details how information is organized in the Data Export file. The sample tab and resulting display are set to Iowa.
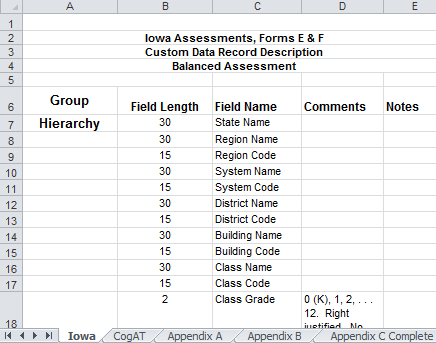
The custom template, shown below, allows you to select fields to include, specify the order of the fields, and rename the fields. The sample tab and resulting display are set to Iowa.
-
When you have entered your report parameters, continue with the next step.
The following table applies to data exports for all assessment products.
Student Roster
Produces a report that lists each student's test, skill domain, and *cognitive level or displays a breakdown of the test items for each skill domain with each student's response for the item.
*Cognitive levels provide a hierarchy of critical thinking skills; the three included in the report are Essential Competencies, Conceptual Understanding, and Extended Reasoning.
When you have entered your report parameters, continue with the next step.
|
Field |
Selections |
Description |
|
|
GRADE/LEVEL |
Grades 2 - 11 with corresponding levels and subjects |
Any listed combination of grade, test level, and, if available, subject or battery. Only those grades and levels that were tested are available for selection. |
|
|
LEVEL OF ANALYSIS |
|
Skill Domain Analysis produces a report focused on students' mastery of the content area. Item analysis produces a report centered on the question items themselves and which ones students answered correctly or incorrectly. |
|
|
SKILL DOMAIN CLASSIFICATION |
Common Core State Standards |
Interim Assessments use Common Core State Standards exclusively. |
|
|
SCORE(S) |
Select 1 - 5 of the following: |
For more information on scores, see Score Descriptions for Interim Assessments. See SCORE FILTERS below for instructions on how to narrow results to students who scored at or within range of a certain number or percentile. |
|
|
Click to select or clear any of the scoring factors that appear for your report.
Include Students Coded in Office Use Refers to the "Office Use Only" section of a student answer document. Identifies students whose test scores should be included or excluded from group averages.
|
|||
|
CONTENT SCOPE |
1 or more of the following:
|
Select one or more to view targeted skills on the report. |
|
|
SUB CONTENT SCOPE |
1 or more specific areas within the CONTENT SCOPE |
Varies by CONTENT SCOPE and GRADE/LEVEL. |
|
|
REGION/SYSTEM/DISTRICT/ BUILDING/CLASS |
|
Determines the population scope of your report. The field name depends on your setup and permissions (for example, BUILDING if you are a Building or School Administrator). If you select a specific location, a new sub-level field opens below. This continues for all available locations (down to the level of CLASS). |
|
|
POPULATION FILTERS |
4 categories, 1 selection allowed for each.
|
Narrows results by gender, ethnicity, program (such as IEP or Gifted), and/or administrative code. |
|
|
SCORE FILTERS |
Instructions |
Narrows results based on score and content area. (Available for Skill Domain Analysis only) |
|
|
SCORE WARNING / INDICATOR FILTERS |
Instructions |
Narrows results by a particular score warning message or indicator. (Available for Skill Domain Analysis only.) |
|
|
Output Format |
|
View charts containing students and test items in an online table/spreadsheet or download them to an Excel output format. Available for Item Analysis only. |
|
Multimeasure Student Roster
Allows you to create up to ten columns across multiple test administrations, test types, grades, and levels for each student in a selected group. A PERFORMANCE BANDS option allows you to specify performance indicator labels and values that color-code the test results for each student. Default ranges appear for the SCORE(S) ISS-D ISS-T, but you can change them by typing different values.
When you have entered your report parameters, continue with the next step.
Student Profile
Displays one of several types of graphs showing each student's scores reflecting skill domain and cognitive level. Longitudinal and progress monitoring graphs provide measures for tracking student improvements over a period of time.
When you have entered your report parameters, continue with the next step.
|
Field |
Selections |
Description |
|
|
GRADE/LEVEL |
Grades 2 - 11 and corresponding levels |
Any listed combination of grade, test level, and, if available, subject or battery. Only those grades and levels that were tested are available for selection |
|
|
LEVEL OF ANALYSIS |
|
Test Analysis views students by test score. Skill Domain analyzes scores by skill domains and cognitive levels. Selecting this creates the SKILL DOMAIN CLASSIFICATION field. |
|
|
DISPLAY OPTIONS |
Options are determined by LEVEL OF ANALYSIS selection. Selection determines available selections for SCORE(S) (below). * Creates Test Administrations field below. |
||
|
SKILL DOMAIN CLASSIFICATION |
|
Determines which classification domain (for example, Common Core State Standard Domains) is used to define and group skills. |
|
|
SCORE(S) |
1 of the following:
|
Selection for LEVEL OF ANALYSIS and DISPLAY OPTIONS determines available SCORE(S) for the report. For additional information about a field, see descriptions for Interim fields. |
|
|
CONTENT SCOPE |
|
Select one or both, if available, to view targeted skills on the report. |
|
|
SUB CONTENT SCOPE (Skill Domain Analysis only) |
A list of target areas within the CONTENT SCOPE(s) selected in the previous (CONTENT SCOPE) field. |
Options vary by LEVEL OF ANALYSIS, DISPLAY OPTIONS, and GRADE/LEVEL. |
|
|
REGION/SYSTEM/DISTRICT/ BUILDING/CLASS |
|
Determines the population scope of your report. The field name depends on your setup and permissions (for example, BUILDING if you are a Building or School Administrator). If you select a specific location, a new sublevel field opens below. This continues for all available locations (down to the level of CLASS). |
|
|
STUDENT |
|
All runs the report for all students in the location specified in the locations field above. |
|
|
TEST ADMINISTRATIONS |
Select up to four test administrations from the test administrations listed. If multiple assessments exist for a given date, point to the test administration date, and a list of grades/levels opens; select one from each list. |
The list includes the previously selected Test Administration Date, which is set as the end point for the graph. |
|
|
The options below are available only when DISPLAY OPTIONS is set to Balanced Assessment Line Graph. |
|||
|
GROWTH START POINT TYPE |
|
If you select Iowa Assessments, you must select an Iowa Assessments test administration in the Growth Start Point field for the starting point of the growth goal line. If you select GROWTH GOAL, you must select a PR in the GROWTH GOAL field. |
|
|
GROWTH START POINT |
Select an Iowa Assessments test administration date. |
Selection marks the beginning date of the growth goal line. |
|
|
GROWTH END POINT |
Select a season (fall, midyear, or spring) and year. |
Selection marks the end date (season/year) of the growth goal line. |
|
|
GROWTH GOAL |
If your GROWTH START POINT Type is Iowa Assessments, then select one of the following options:
If your GROWTH START POINT TYPEis GROWTH GOAL, then select the PR (from 10th to 99th). |
Selection determines the measure of growth between the start and end points |
|
Group Roster
Provides one of the following: group scores for skill domain and cognitive levels; item summary reports, which provide a breakdown of the test items used to measure each skill domain and, for each test item, the percentage of the group that selected each answer.
When you have entered your report parameters, continue with the next step.
|
Field |
Selections |
Description |
|
|
GRADE/LEVEL |
Grades 2 - 11 with corresponding levels and subjects |
Any listed combination of grade, test level, and subject. Only those grades and levels that were tested are available for selection. |
|
|
LEVEL OF ANALYSIS |
|
Skill Domain Analysis produces a report focused on groups' mastery of the skill areas. It allows scores to be reported, where Item Analysis does not. Item analysis centers on the question items themselves, which skill domains they reflect, and the number of students who answered them correctly. |
|
|
SKILL DOMAIN CLASSIFICATION |
|
College and Career Readiness for Reading (CCR) is available for ELA assessments only. |
|
|
SCORE(S) |
1 - 4 of the following:
|
For more information on scores, see Score Descriptions for Interim Assessments. See SCORE FILTERS below for instructions on how to narrow results to students who scored at or within range of a certain number or percentile. |
|
|
Click to select or clear any of the scoring factors that appear for your report.
Include Students Coded in Office Use Refers to the "Office Use Only" section of a student answer document. Identifies students whose test scores should be included or excluded from group averages.
|
|||
|
CONTENT SCOPE |
|
Select one or both, if available, to view targeted skills on the report. |
|
|
SUB CONTENT SCOPE |
1 or more specific areas within the CONTENT SCOPE |
Varies by CONTENT SCOPE and GRADE/LEVEL. |
|
|
REGION/SYSTEM/DISTRICT/ BUILDING/CLASS |
|
Determines the population scope of your report. The field name depends on your setup and permissions (for example, BUILDING if you are a Building or School Administrator). If you select a specific location, a new sublevel field opens below. This continues for all available locations (down to the level of CLASS). |
|
|
POPULATION FILTERS |
4 categories, 1 selection allowed for each.
|
Narrows results by gender, ethnicity, program (such as IEP or Gifted), and/or administrative code. |
|
|
SCORE FILTERS |
Instructions |
Narrows results based on item or percentile scores. (Available for Skill Domain Analysis only) |
|
Subgroup Roster
Provides scores by test, skill domain, or cognitive level for all subgroups or a selected subgroup—gender, federal race/ethnicity, programs, and/or administrator codes.
When you have entered your report parameters, continue with the next step.
|
Field |
Selections |
Description |
|
|
GRADE/LEVEL |
Grades 2 - 11 with corresponding levels and subjects |
Any listed combination of grade, test level, and subject. Only those grades and levels that were tested are available for selection. |
|
|
LEVEL OF ANALYSIS |
|
Skill Domain Analysis produces a report focused on groups' mastery of the skill areas. It allows scores to be reported, where Item Analysis does not. Item analysis centers on the question items themselves, which skill domains they reflect, and the number of students who answered them correctly. |
|
|
SKILL DOMAIN CLASSIFICATION |
|
CCR is available for ELA assessments only. |
|
|
SCORE(S) |
Select 1 - 4 of the following:
|
For more information on scores, see Score Descriptions for Interim Assessments. See SCORE FILTERS below for instructions on how to narrow results to students who scored at or within range of a certain number or percentile. |
|
|
Click to select or clear any of the scoring factors that appear for your report.
Include Students Coded in Office Use Refers to the "Office Use Only" section of a student answer document. Identifies students whose test scores should be included or excluded from group averages.
|
|||
|
CONTENT SCOPE |
|
Select one or both, if available, to view targeted skills on the report. |
|
|
SUB CONTENT SCOPE |
One or more specific areas within the CONTENT SCOPE |
Varies by CONTENT SCOPE and GRADE/LEVEL. |
|
|
REGION/SYSTEM/DISTRICT/ BUILDING/CLASS |
|
Determines the population scope of your report. The field name depends on your setup and permissions (for example, BUILDING if you are a Building or School Administrator). If you select a specific location, a new sub-level field opens below. This continues for all available locations (down to the level of CLASS). |
|
|
POPULATION FILTERS |
4 categories, 1 selection allowed for each.
|
Narrows results by gender, ethnicity, program (such as IEP or Gifted), and/or administrative code. |
|
|
SCORE FILTERS |
Instructions |
Narrows results based on item or percentile scores. (Available for Skill Domain Analysis only) |
|
Group Profile
Provides the average score for a selected group by test, skill domain, content, cognitive level, proficiency level, and/or any population parameters you specify, with some reports offering the option to view longitudinal information where relevant data exists.
When you have entered your report parameters, continue with the next step.
|
Field |
Selections |
Description |
|
GRADE/LEVEL |
Grades 2 - 11 and corresponding levels |
Any listed combination of grade, test level, and subject. Only those grades and levels that were tested are available for selection |
|
LEVEL OF ANALYSIS |
|
Test Analysis views groups of students by test score. Skill Domain analyzes scores by skill domains and cognitive levels. Selecting this creates the SKILL DOMAIN CLASSIFICATION field. |
|
DISPLAY OPTIONS |
Select 1 from the following 5:
|
Options vary by LEVEL OF ANALYSIS selection. Selection determines available selections for SCORE(S) (below). * Creates Test Administrations field below. |
|
SKILL DOMAIN CLASSIFICATION |
|
Determines which classification domain (for example, Common Core State Standard Domains) is used to define and group skills. * Applies to English Language Arts (ELA) only |
|
SCORE(S) |
- Interim Scaled Score for Skill Domains (ISS-D) - Interim Scaled Score for Tests (ISS-T) - Estimated Iowa Assessments Standard Score (eSS) - Standard Score (SS) / Estimated Iowa Assessments - Standard Score (eSS)
|
Not available for Bar Graph Display Option. For additional information about a field, see descriptions for Interim fields. |
|
CONTENT SCOPE |
MATHEMATICS ELA |
Select one or both, if available, to view targeted skills on the report. |
|
SUB CONTENT SCOPE |
A list of target areas within the CONTENT SCOPE(s) selected in the previous (CONTENT SCOPE) field. |
Options vary by CONTENT SCOPE, DISPLAY OPTIONS, and GRADE/LEVEL. |
|
REGION/SYSTEM/DISTRICT/ BUILDING/CLASS |
|
Determines the population scope of your report. The field name depends on your setup and permissions (for example, BUILDING if you are a Building or School Administrator). If you select a specific location, a new sublevel field opens below. This continues for all available locations (down to the level of CLASS). |
|
LONGITUDINAL TYPES |
|
Describes the cohort under longitudinal or progress monitoring study. This field appears when the Display Option is set to Progress Monitoring Line Graph or Longitudinal Line Graph. |
|
TEST ADMINISTRATIONS |
Select up to 4 test administrations from the test administrations listed. If multiple assessments exist for a given date, point to the test administration date, and a list of grades/levels opens; select one from each list. |
The list includes the previously selected Test Administration Date, which is set as the end point for the graph. |
|
POPULATION FILTERS |
4 categories, 1 selection allowed for each - Gender - Federal Race Ethnicity - Programs - Administrator Codes |
Narrows results by gender, ethnicity, program (such as IEP or Gifted), and/or administrative code. |
5. (Optional) To save the current selection criteria for future use:
a. Click the Save Criteria button in the lower left corner of the page. A Save Criteria box opens. The CRITERIA NAME defaults to the report type you entered.
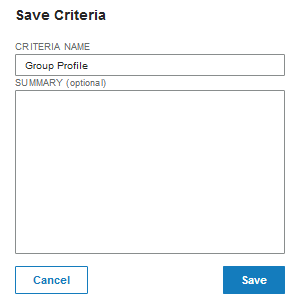
b. Type in the CRITERIA NAME box to change or add to the name of the saved criteria. To add a description, use the SUMMARY box.
Note: The CRITERIA NAME can be a maximum of 80 characters. The SUMMARY can be a maximum of 255 characters.
c. Click Save.
- If the criteria name does not already exist, a confirmation message appears at the top of the page.
![]()
Continue to step d.
- If the criteria name does already exist, an error message asks you to rename the criteria.
![]()
Enter a different name and click Save again.
d. Click OK. The saved selection criteria is available on the Load/Manage Criteria page. For more information, see Loading and Managing Saved Criteria.
6. Run the report using one of the following options.
|
To do the following... |
Follow these instructions... |
|
Run the report immediately as you wait. |
|
|
Submit the report to run in the background. |
|
See Also: