
The following student profile displays are available for the assessments specified in parentheses:
Bar Graph
The Student Profile—Bar Graph displays a bar graph of students' scores by test and composite or by skill domain and cognitive level, for each student in the selected group(s). The top of each page of the report provides the report scope and test information, including some or all of the following: the student's name, student ID, assessment, form, test date, norms, grade, level, class, building, district (if applicable), system, region (if applicable), and state.
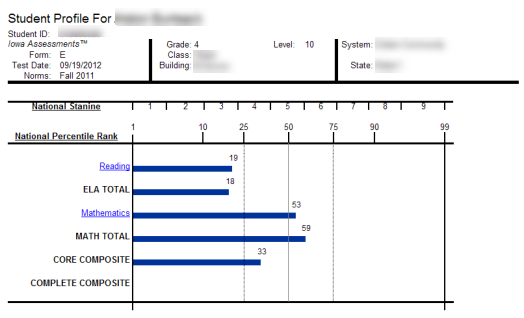
Note: Data in this sample are for illustrative purposes only.
Bar Graph with Confidence Interval (CogAT, GMRT, Iowa, and Logramos)
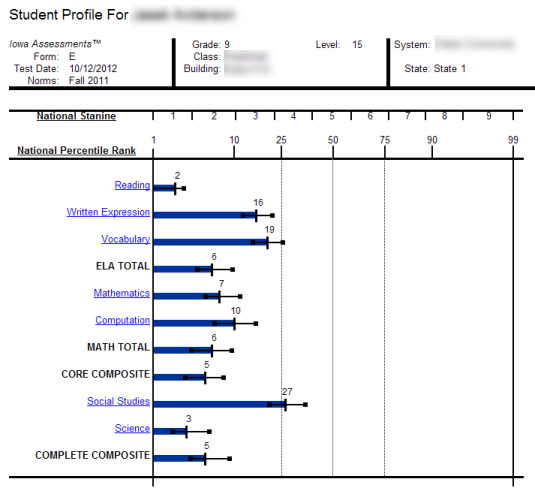
The Student Profile - Bar Graph with Confidence Interval displays a bar graph of students' scores by test and composite or by skill domain and cognitive level, for each student in the selected group(s). The top of each page of the report provides the report scope and test information, including some or all of the following: the student's name, student ID, assessment, form, test date, norms, grade, level, and location with the addition of a confidence interval for each score, which provides a visual representation of the margin of error that may apply to each test score.
This image shows a report for an Iowa Assessments test.
The image below shows a report for GMRT.
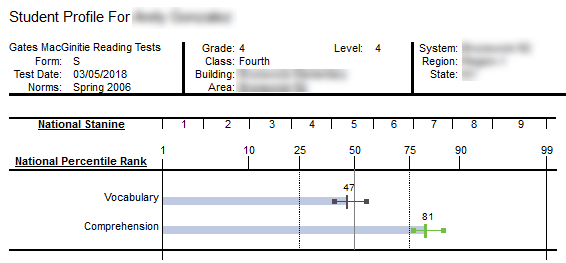
Note: Data in this sample are for illustrative purposes only.
Longitudinal Line Graph (GMRT, Interim Assessments, Iowa, and Logramos)
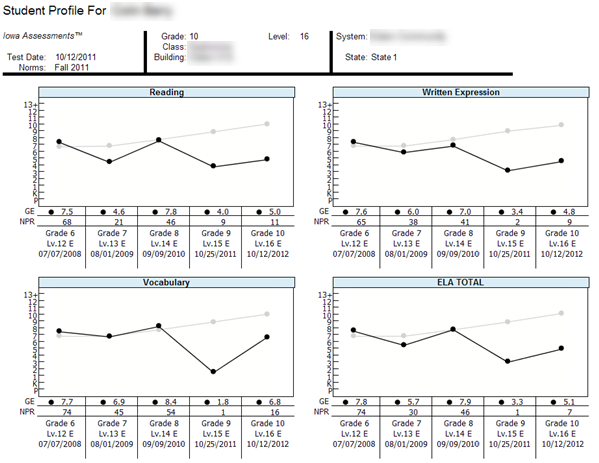
The Student Profile — Longitudinal Line Graph displays a series of line graphs showing a student's test and composite scores over time for up to five test administrations. For comparison purposes, the Iowa Assessments and Logramos graphs also display the growth in achievement for the average student in the nation over the same period of time.
This image shows a report for the Iowa Assessments.
The image below shows a longitudinal report for GMRT.
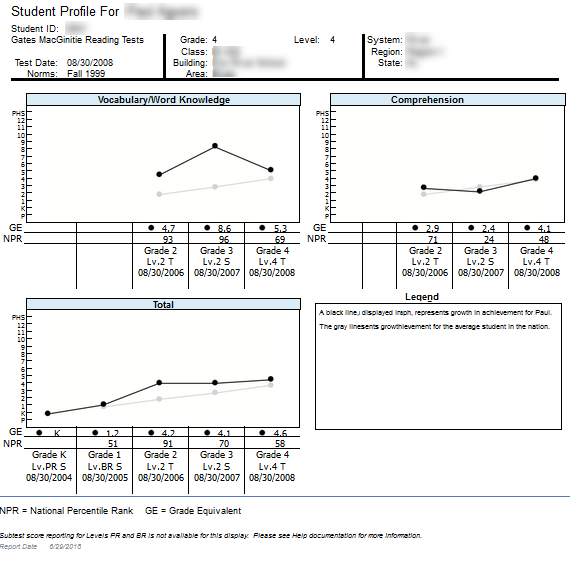
Note: Data in this sample are for illustrative purposes only.
Balanced Assessment Line Graph (Interim and Iowa Assessments)
The Student Profile — Balanced Assessment Line Graph presents results from Iowa Assessments and Riverside Interim Assessments and allows you to set growth goals for a student and track the student's progress over time. The ELA Total or Mathematics Total scores from up to five test administrations are displayed. For each Riverside Interim Assessments test administration, the score is presented as an Estimated Iowa Assessments Standard Score (eSS), which is an estimated score range for the Iowa Assessments derived from the Riverside Interim Assessments results. A blue line indicates the growth goal that you set for the student. The scores for each test administration appear as red or green, indicating that the student is above or below the growth goal, respectively. For comparison purposes, the graphs also display a gray line representing the growth in achievement for the average student in the nation over the same period of time.
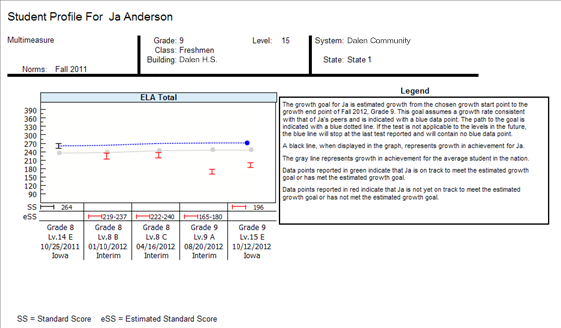
Note: Data in this sample are for illustrative purposes only.
Progress Monitoring Line Graph (Interim Assessments only)
The Student Profile — Progress Monitoring Line Graph allows you to track the progress of a student by skill domain for up to three test administrations taken within the year.