List of Student Scores (CogAT, Iowa Assessments, and Logramos)
The List of Student Scores report provides the test and composite scores for each student in the selected group(s). The top portion of the report provides the report scope and test information, such as assessment, test date, norms, grade, class, building, district (if applicable), system, region (if applicable), and state. The first column of the report lists each student by name and includes some or all of the following: student ID, birth date, age at testing, form, level, and gender. The remaining columns provide the student's test and composite scores.
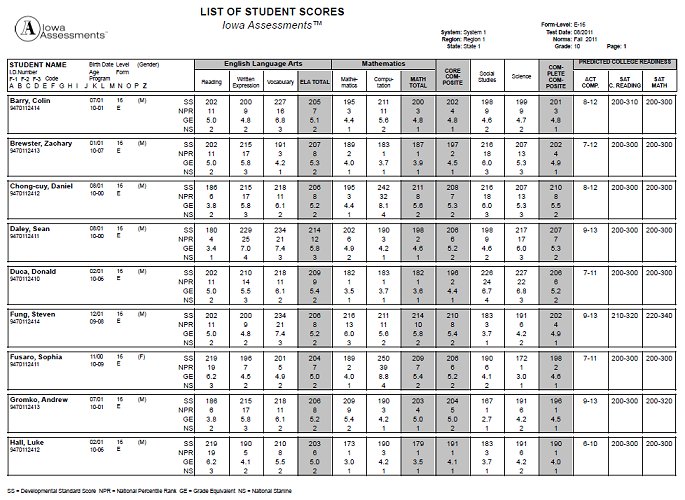
Note: Data in this sample are for illustrative purposes only.
Student Profile Narrative (CogAT, Iowa Assessments, and Logramos)
The Student Profile Narrative report provides a table of each individual student's scores, a graph of the student's NPR (for Iowa Assessments ) or APR (for CogAT), and a narrative overview of how to interpret and use the scores to assist in the student's educational development. The top portion of the report provides the student name, class name, report scope, and test information, such as assessment, test date, norms, grade, building, district (if applicable), system, region (if applicable), and state.
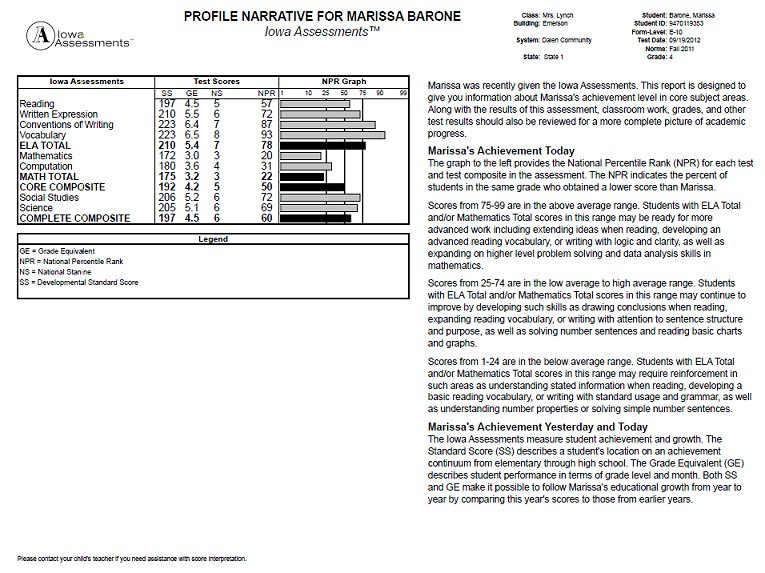
Note: Data in this sample are for illustrative purposes only.
Group Summary (CogAT, Iowa Assessments, and Logramos)
The Group Summary report presents the average scores for a selected group. The top portion of the report provides the group or class name, report scope, and test information, such as assessment, test date, norms, grade, building, district (if applicable), system, region (if applicable), and state. The first column of the report lists the number of students in the group and the scores selected to appear on this report. The remaining columns list the average test and composite scores for the group.
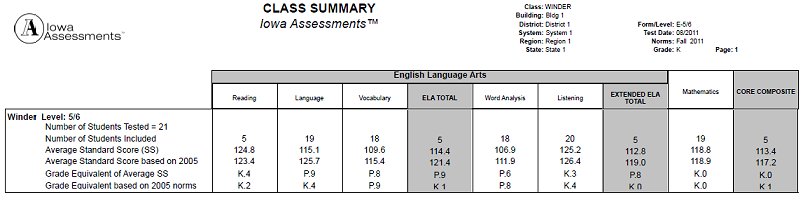
Note: Data in this sample are for illustrative purposes only.
Individual Performance Profile (Iowa Assessments and Logramos only)
The Individual Performance Profile report (IPP) produces a student skill-level report as a PDF from the DataManager Report Center.
The report displays a student's scores on individual tests with bar graph (with or without Confidence Band) representing National Percentile Rank (default) and/or Local Percentile Rank (if ordered at the time of scoring). The bottom table displays domain and cognitive-level scores with graphs of Difference measures.
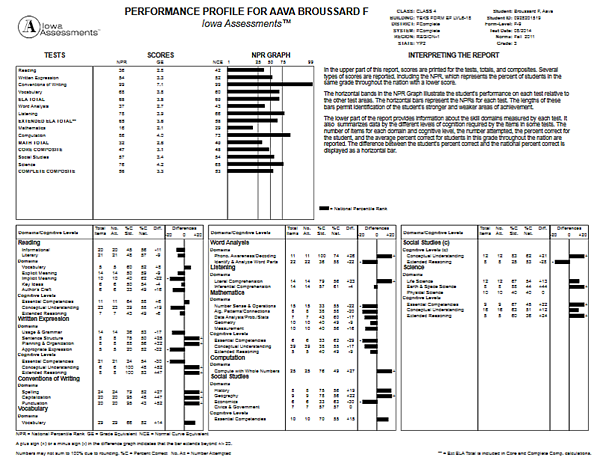
Note: Data in this sample are for illustrative purposes only.
Group Performance Profile (Iowa Assessments and Logramos only)
The Group Performance Profile (GPP) report provides a summary of test and domain scores for a class, for grade groups in a building, or for an entire school system. The report includes an average score profile and a graph displaying the National Percentile Rank (NPR) for each test taken. The bottom table shows comparative values for domains and cognitive levels.
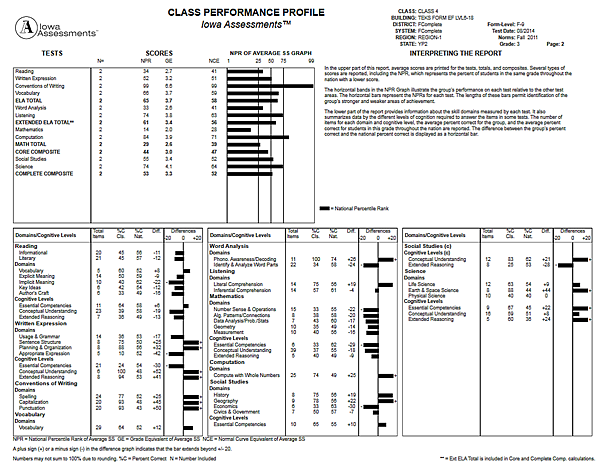
Note: Data in this sample are for illustrative purposes only.
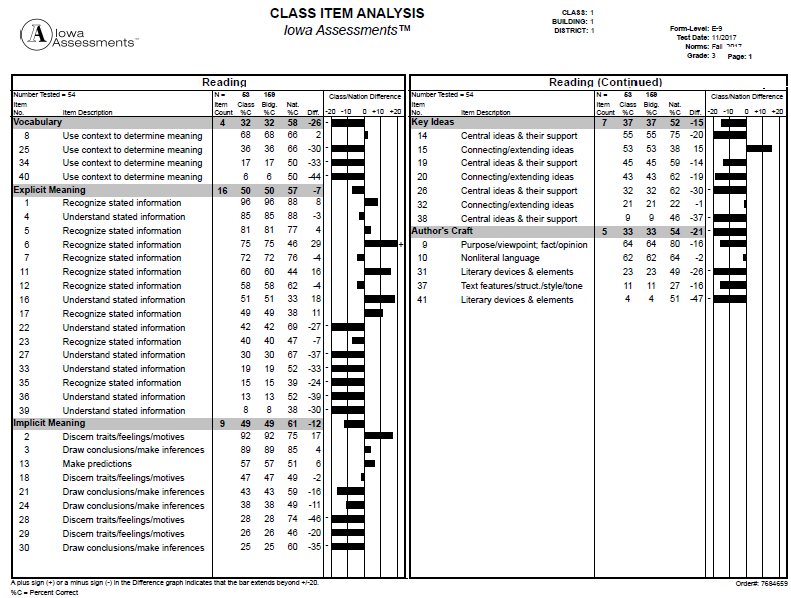
Group Item Analysis (Iowa Assessments and Logramos only)
This report provides the Iowa Assessments or Logramos percent-correct scores for each item on a test, sorted by skill domains. It displays the average performance of the group (in this case, a class) and compares it to the average national performance in addition to 1-2 groups (for example, a district and/or a building) of the user's choosing (at run-time).
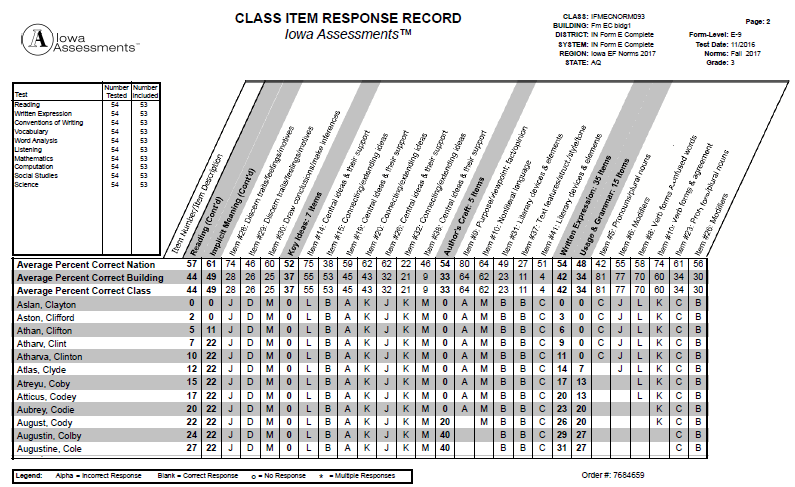
Class Item Response Record (Iowa Assessments and Logramos only)
This report displays each student's response to every test item on an Iowa Assessments or Logramos test. By default, it also shows the national average of percent-correct scores. Users can select an additional group by which to compare individual student responses (such as a building or a district). The report contains two parts, Class Item Response Record and Class Item Response Summary.
Important: Due to the scope and granularity of item-level data, this report takes longer to run. Additionally, it renders multi-page results in a single PDF file. Please consider the optimal size of your PDF file before running the report.