
DataManager reports can be run from the Reports > Classic menu. Two new reports have been added to the legacy-style reports to measure estimated growth differentials due to school closures during the Covid-19 shutdown.
For more information on available legacy reports, see one of the options below. For more detailed descriptions, refer to the Score Interpretation Guide for your test and level. You can find this on the Digital Resources page, accessed by signing in to your DataManager account and clicking the Resources link on the banner of most pages.
To create a report now, jump to the See Also topics at the bottom of this page.
Unless otherwise noted, the report types below are available for all assessment families (CogAT, GMRT, Interim Assessments, Iowa Assessments, and Logramos). They are listed here in approximately the same order as they appear on the Create a Report tab of the Reports Center page, except where grouped by product (for example, Texas-only) or style (Scoring Service Print Style - SSPS).
Note: Unless otherwise noted, descriptions of Iowa Assessments reports apply to all forms and batteries, including Single Subjects.
![]() GMAS (Iowa Assessments/Georgia only)
GMAS (Iowa Assessments/Georgia only)
![]() STAAR (Iowa Assessments/Texas only)
STAAR (Iowa Assessments/Texas only)
![]() NEW Student Roster (Early School Closure)
NEW Student Roster (Early School Closure)
![]() Scoring Service Print Style (CogAT, Iowa Assessments, and Logramos only)
Scoring Service Print Style (CogAT, Iowa Assessments, and Logramos only)
Report descriptions
GMAS (Iowa Assessments/Georgia only)
- GMAS Prediction Summary
The Georgia Milestones Assessment System (GMAS®) Prediction Summary report shows a four-level performance-band prediction for Georgia students grades 3 - 8 who have tested on-level using the Iowa Assessments. Students' predicted scores are aggregated and reported for up to four content areas: Reading, Mathematics, Social Studies, and Science.
The header of each page provides the report scope and test information, including some or all of the following: assessment, form, test date, norms, grade, and level.
The body of the report displays pie charts of four achievement levels associated with GMAS: (1) Beginning Learners (2) Developing Learners (3) Proficient Learners (4) Distinguished Learners. The legend includes the number and percent of students who scored in each achievement category.
To view the specific students included in an achievement level, click the number or percent value for any level. A roster report opens for the students in that level. From there, you can click individual student names to view detailed information and scores.
- GMAS Student Roster
The Georgia Milestones Assessment System (GMAS®) Student Roster report displays individual student scores for Georgia students grades 3 - 8 who have tested on-level using the Iowa Assessments. Scores on the GMAS Student Roster report can include core reading and/or math scores for all eligible grades/levels and social studies and science for grades 5 and 8. You can run the report from the Create a Report page or access it through the GMAS Prediction Summary report.
The header of each page provides the report scope and test information, including some or all of the following: assessment, form, test date, norms, grade, level, and location.
Within the report, the first column of each row contains entries for the following: student's name, ID number, secondary student ID (if applicable), birth date, age, program, level, form, administration mode, gender, and administrator code (if applicable). The remaining columns in the row provide each student's scores for the Iowa Assessments batteries administered.
Note: Student Rosters display a maximum of 25 students per page.
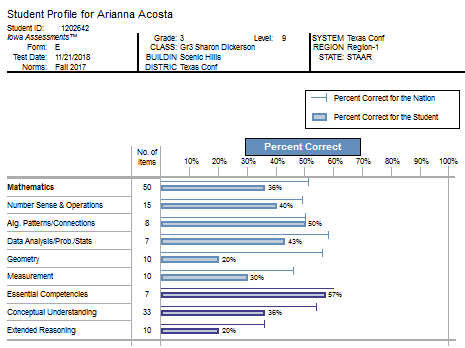
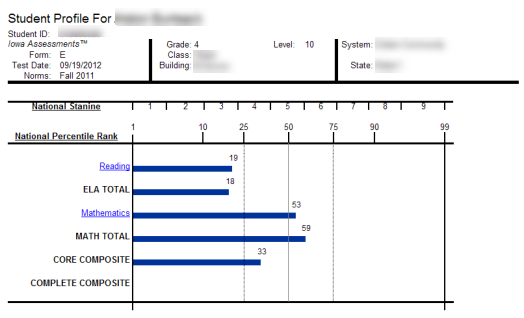
You can click a student's name within the report to open the profile for that student. The profile page shows the student's National Percentile Rank (NPR) score. From here, you can view information about a test by holding your cursor over the test category (Mathematics in the example below). To see a skill-based breakdown of the student's scores, click the Reading or Mathematics link in the score column.
STAAR (Iowa Assessments/Texas only)
- STAAR Prediction Summary
The State of Texas Assessments of Academic Readiness (STAAR®) Prediction Summary report shows a four-level performance-band prediction for Texas students grades 3 - 8 who have tested on-level using the Iowa Assessments. Students' predicted scores are aggregated and reported for up to three content areas: Reading, Mathematics, and Science.
The header of each page provides the report scope and test information, including some or all of the following: assessment, form, test date, norms, grade, level, location, and the total number of students tested.
The body of the report displays pie charts of the four performance levels associated with STAAR: Masters Grade Level, Meets Grade Level, Approaches Grade Level, or Did Not Meet Grade Level. The legend includes the number and percent of students who scored in the performance category.
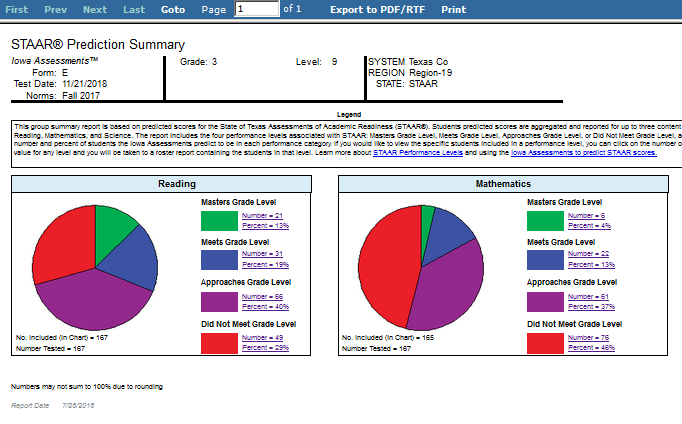
To view the specific students included in a performance level, click the number or percent value in the legend. A roster report opens for the students in that level. From there, you can click individual student names to view detailed information and scores.
- STAAR Student Roster
The State of Texas Assessments of Academic Readiness (STAAR®) Student Roster report displays individual student scores for Texas students grades 3 - 8 who have tested on-level using the Iowa Assessments. Scores on the STAAR Student Roster report can include core reading and/or math scores for all eligible grades/levels and science for grades 5 and 8. You can run the report from the Create Report page or access it through the Prediction Summary report.
The header of each page provides the report scope and test information, including some or all of the following: assessment, form, test date, norms, grade, level, location, and the total number of students tested.
Within the report, the first column of each row contains entries for the following: student's name, ID number, secondary student ID (if applicable), birth date, age, program, level, form, administration mode, gender, and administrator code (if applicable). The remaining columns in the row provide each student's scores for the Iowa batteries administered.
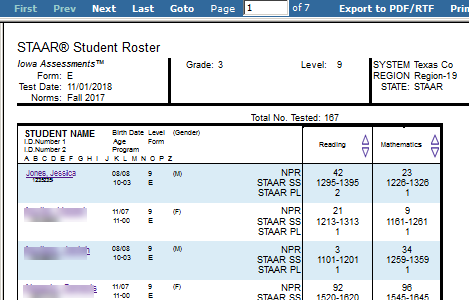
Note: Student Rosters display a maximum of 25 students per page.
You can click a student's name within the report to open the profile for that student.
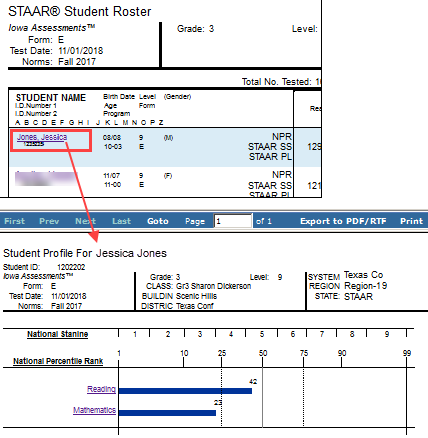
To see a further breakdown of scores by reading or math categories, click the Reading or Mathematics link in the score column.
Data Export
Data Export files are available to users with Account Holder or Administrator roles.
These files contain data for a test event and can be exported as .txt files in the following formats:
-
- ASCII Fixed-Width
- ASCII Tab-Delimited
- ASCII Comma-Delimited
- ASCII Pipe-Delimited.
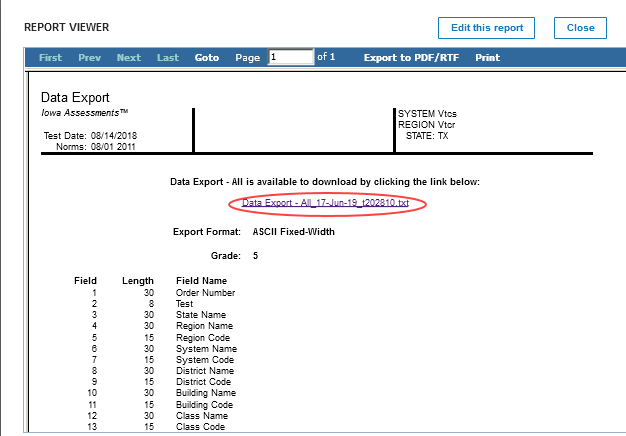
The data is available to be downloaded after a report has been run. To do this, click the link on the report page as shown below.
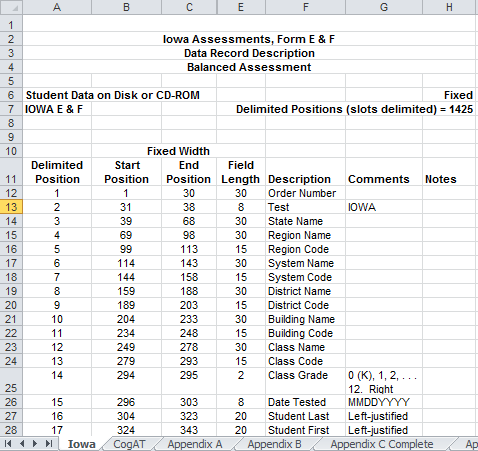
When you create a Data Export file, you can choose to export it using a standard or a custom format.
The standard format, shown below, details how information is organized in the Data Export file. The sample tab and resulting display are set to Iowa.
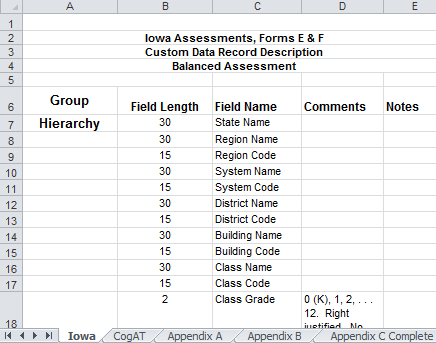
The custom template, shown below, allows you to select fields to include, specify the order of the fields, and rename the fields. The sample tab and resulting display are set to Iowa.
NEW Student Roster (Early School Closure)
The NEW Student Roster — Estimated Growth Report, Early School Closure (ESC) Edition, compares a student's original estimated growth trajectory to a new trajectory that reflects Covid-19-related school closures. The ESC trajectory assumes zero growth from quartermonth 25 (QM 25, March 8 - 15, 2020).
Comparing estimated student growth (ESG) for a typical school year (TSY) with growth for the early school closures (ESC) can help you determine:
- The impact of school closures on students' academic growth
- The efficacy of distance learning programs per grade, content, and/or location (class, school, district, region)
- Different impacts on different student populations
Note: In order to have this report available to you, your students must have tested at least once during the 2018-19 school year and once since the school shutdown (QM 25).
The report heading provides the report type, the test (Iowa Assessments is required for this report) and form, the test date, and the norms being used for scoring. The center bracket shows the grade and level, the right bracket the location. The total number of students tested appears just below the heading, directly above the table of scores.
Based on the heading below, testing for the Student Roster ESC Edition took place on August 1st, 2020 using Iowa Assessments Form E and Fall 2017 norms. 1,479 fifth-graders across Region-1 of the state were tested.
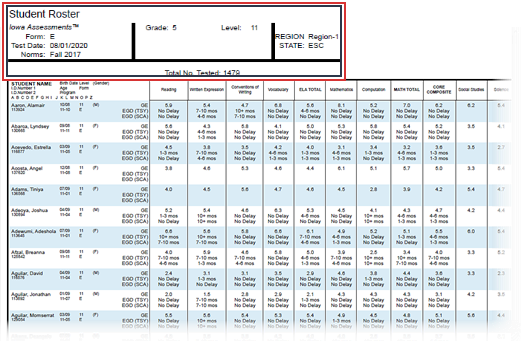
The report itself, for each student, displays a student's name and ID number, secondary student ID (if applicable), birth date, age, and gender, and test level and form. The remaining columns in the table provide the student's scores for each test and composite.
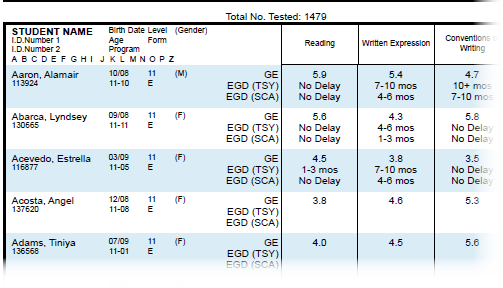
The New Student Roster report displays three scores:
- GE: the grade equivalent of the student's score on the assessment; fifth-grade students testing in August 2020 at level 11 Reading scored in a range of grade equivalencies, from above-grade (5.9 and 5.6, for the top two students shown in the table) to below-grade (4.5, 3.8, and 4.0, for the remaining three shown here).
- EGD (TSY): the estimated delay in growth of the student for a typical school year; both of the top two students had no growth delays for Reading, while the third student experienced a 1-3-month delay. (The bottom two students shown here did not participate in a past test event, so growth delay was not measurable.)
- EGD (SCA): the estimated delay in growth of the student, adjusted for early school closures; DataManager estimates zero growth from the time of most school closures, March 2020. Because growth is expected to flatten, these scores will always show a better outcome than those for a typical school year. As the table of scores above demonstrates, while the third student had a 1-3 month delay for EGD (TSY), the student scored above the adjusted growth delay. The difference is consistent for the Written Expression test scores, where the delay is greater for the TSY than for the SCA.
Student Roster
The Student Roster provides scores by test and composite or by skill domain and cognitive level for each student in the selected group. The top of each page of the Student Roster provides the report scope and test information, including some or all of the following: assessment, form, test date, norms, grade, level, location, and the total number of students tested.
Within the report, the first column of each row contains a student's name, ID number, secondary student ID (if applicable), birth date, age, program, level, form, administration mode, gender, and administrator code (if applicable). The remaining columns in the row provide the student's scores for each test and composite or skill domain and cognitive level.
You can click a student's name within the report to open the profile for that student.
Note: Student Rosters display a maximum of 25 students per page.
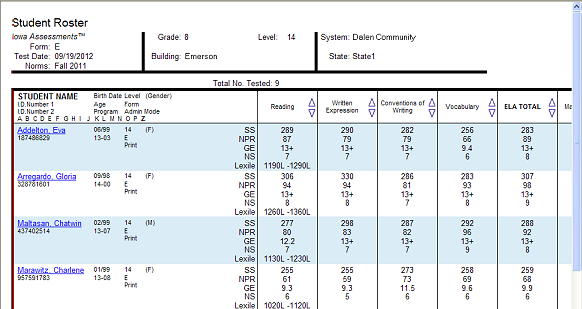
Note: Data in this sample are for illustrative purposes only.
- Student Roster Item Response Record (Riverside Interim Assessments only)
The web display version of the Student Roster Item Response Record is a multi-page report that identifies the test items used to measure each skill domain and provides student responses for each of these test items. Each selected skill domain is provided on a separate page of the report. The top of each page of the report provides the report scope and test information, including some or all of the following: assessment, form, test date, grade, level, class, building, district (if applicable), system, region (if applicable), state, and the total number of students tested.
The blue bar at the top of the report table provides the skill domain for which responses are being identified. The first column lists the names of the students in the selected group. The remaining columns provide the test items used to measure the skill domain and each student’s response to those test items. The column header provides the test item number as well as the cognitive level that is measured using this test item. If a student answered a test item correctly, the cell appears blank; if a student answered incorrectly, the student’s test response is provided. No response is identified as a zero (0), and a multiple response is displayed as an asterisk (*).
Note: Student Rosters display a maximum of 25 students per page.
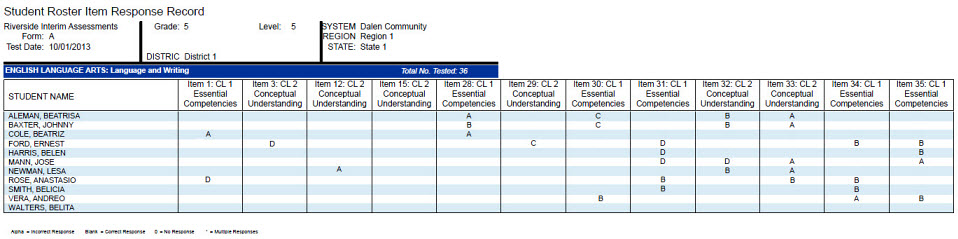
Note: This report is also available as an Excel ® export file. To download as an Excel file, select the Export to Excel option when creating the report.
Multimeasure Student Roster
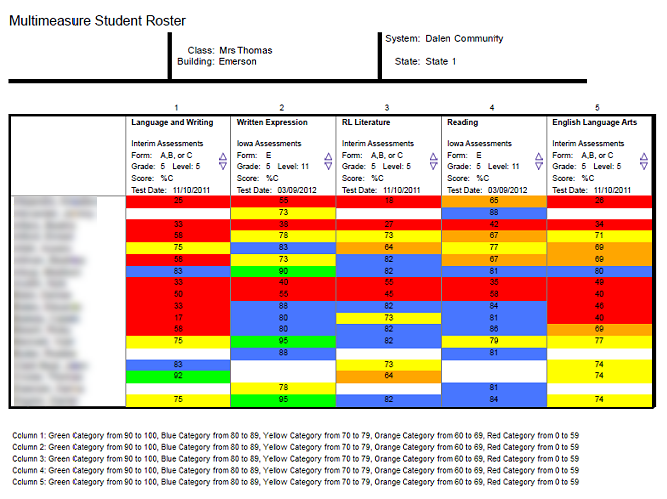
The Multimeasure Student Roster allows you to create a multiple-column report (up to ten columns) that provides scores by test and composite or skill domain and cognitive level for multiple test administrations, test types, grades, and levels for each student in the selected group. This report also provides a PERFORMANCE BANDS option, which allows you to specify performance indicator labels and values that color code the test results for each student. For example, you could assign green to represent "proficient," yellow to represent "approaching proficiency," and red to represent "needs improvement." A footnote is provided at the bottom of the report identifying the labels and value ranges assigned for each column.
This report shows a five-column report for Interim Assessments.
The image below shows a three-column report for GMRT.
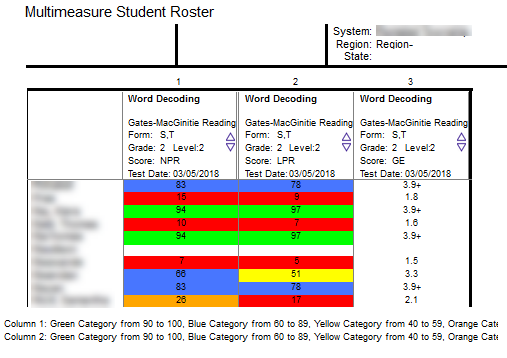
Note: Data in this sample are for illustrative purposes only.
Student Profile
The following student profile displays are available for the assessments specified in parentheses:
- Bar Graph
The Student Profile—Bar Graph displays a bar graph of students' scores by test and composite or by skill domain and cognitive level, for each student in the selected group(s). The top of each page of the report provides the report scope and test information, including some or all of the following: the student's name, student ID, assessment, form, test date, norms, grade, level, class, building, district (if applicable), system, region (if applicable), and state.
Note: Data in this sample are for illustrative purposes only.
- Bar Graph with Confidence Interval (CogAT, GMRT, Iowa, and Logramos)
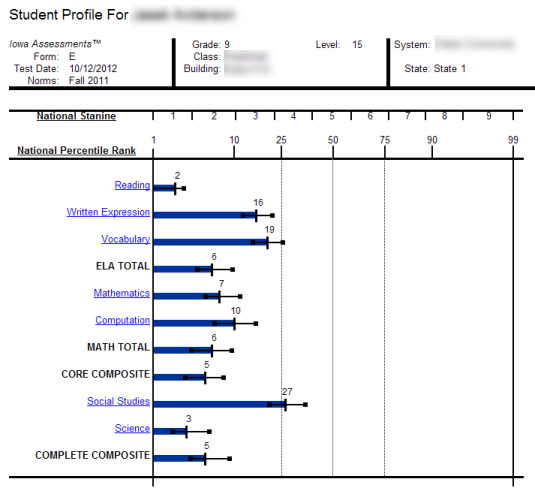
The Student Profile - Bar Graph with Confidence Interval displays a bar graph of students' scores by test and composite or by skill domain and cognitive level, for each student in the selected group(s). The top of each page of the report provides the report scope and test information, including some or all of the following: the student's name, student ID, assessment, form, test date, norms, grade, level, and location with the addition of a confidence interval for each score, which provides a visual representation of the margin of error that may apply to each test score.
This image shows a report for an Iowa Assessments test.
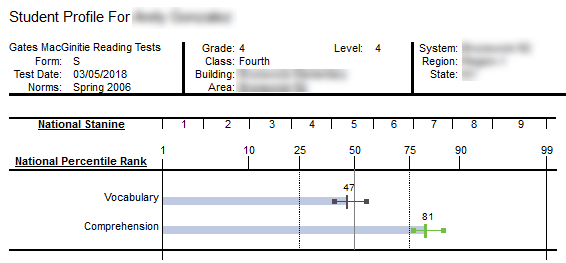
The image below shows a report for GMRT.
Note: Data in this sample are for illustrative purposes only.
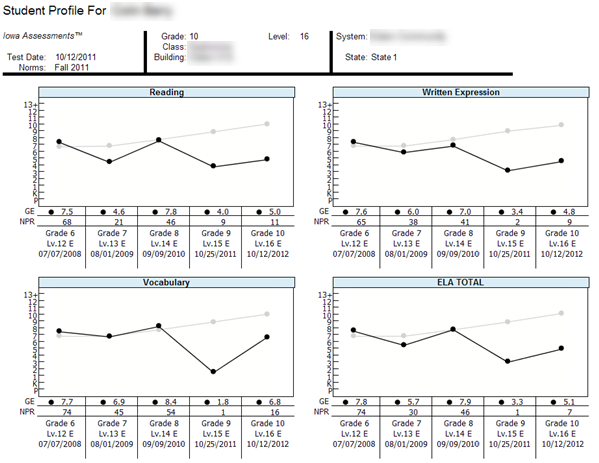
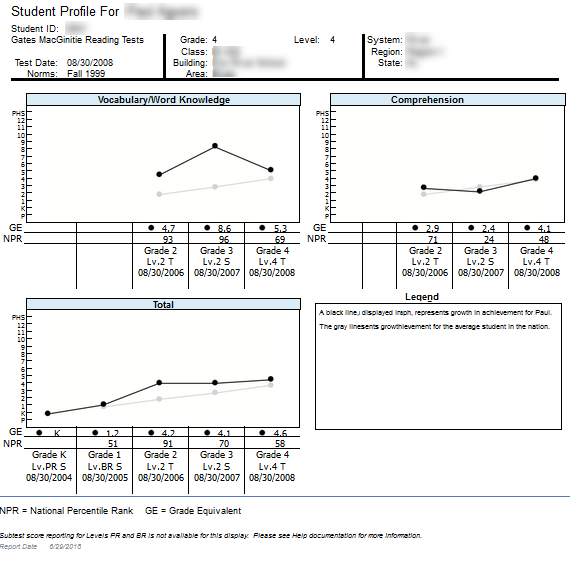
- Longitudinal Line Graph (GMRT, Interim Assessments, Iowa, and Logramos)
The Student Profile — Longitudinal Line Graph displays a series of line graphs showing a student's test and composite scores over time for up to five test administrations. For comparison purposes, the Iowa Assessments and Logramos graphs also display the growth in achievement for the average student in the nation over the same period of time.
This image shows a report for the Iowa Assessments.
The image below shows a longitudinal report for GMRT.
Note: Data in this sample are for illustrative purposes only.
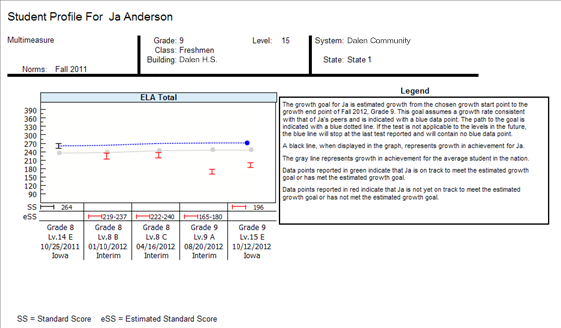
- Balanced Assessment Line Graph (Interim and Iowa Assessments)
The Student Profile — Balanced Assessment Line Graph presents results from Iowa Assessments and Riverside Interim Assessments and allows you to set growth goals for a student and track the student's progress over time. The ELA Total or Mathematics Total scores from up to five test administrations are displayed. For each Riverside Interim Assessments test administration, the score is presented as an Estimated Iowa Assessments Standard Score (eSS), which is an estimated score range for the Iowa Assessments derived from the Riverside Interim Assessments results. A blue line indicates the growth goal that you set for the student. The scores for each test administration appear as red or green, indicating that the student is above or below the growth goal, respectively. For comparison purposes, the graphs also display a gray line representing the growth in achievement for the average student in the nation over the same period of time.
Note: Data in this sample are for illustrative purposes only.
- Progress Monitoring Line Graph (Interim Assessments only)
The Student Profile — Progress Monitoring Line Graph allows you to track the progress of a student by skill domain for up to three test administrations taken within the year.
Note: Data in this sample are for illustrative purposes only.
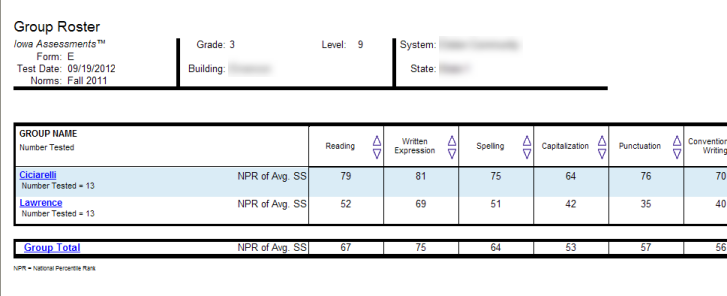
Group Roster
The Group Roster provides scores by test and composite or by skill domain and cognitive level for each selected group—class, building, district, system, or region. The top of each page of the Group Roster provides the report scope and test information, including some or all of the following: assessment, form, test date, norms, grade, level, class, building, district (if applicable), system, region (if applicable), and state.
Groups are displayed by row. The name of each group is shown in the first column; the remaining columns provide the group's score(s) for each test and composite. Under each Group Name, the number of students tested in that group is provided. The Group Total, displayed on the bottom row, provides the selected groups' average scores for each test and composite or skill domain and cognitive level.
You can click a group's name to open the Group Profile for that group or click Group Total at the bottom of the report to open a Group Profile that combines all the selected groups.
Note: Group Rosters display a maximum of 25 groups per page.
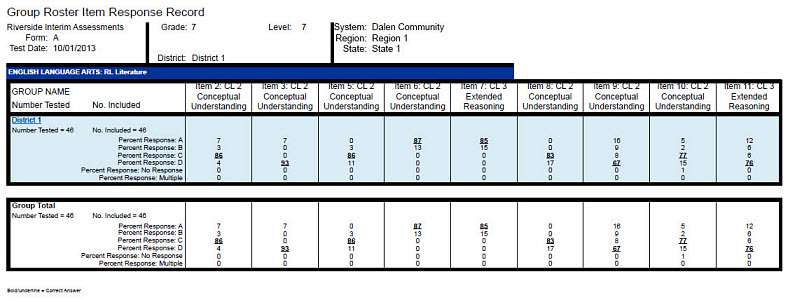
- Group Roster Item Response Summary (Riverside Interim Assessments only)
The web-display version of the Group Roster Item Response Summary identifies the test items used to measure each skill domain for each selected group—class, building, district, system, or region, and it provides the group results for each of these test items. Each selected skill domain is provided on a separate page of the report. The top of each page provides the report scope and test information, including some or all of the following: assessment, form, test date, grade, level, class, building, district (if applicable), system, region (if applicable), and state.
The blue bar at the top of the report table provides the skill domain for which results are being reported. Each test item that is used to measure this skill domain is provided as a separate column. The column header provides the test item number as well as the cognitive level that is measured using this test item. Groups are displayed by row. The name of each group is shown in the upper left corner of the first cell in each row. Directly below the group name is the number of students tested in this group followed by the number of students whose scores are included in the group scores. Possible responses are listed on the left side of the first cell, and the percentage of the group that selected each response is provided in the remaining columns. The percentage representing the correct response for a given test item is displayed in bold and underlined text.
The Group Total, displayed on the bottom row, provides the selected groups' average scores.
You can click a group's name within the report to open the Student Roster Item Response Record for that group.
Note: This report is also available as an Excel export file. To download as an Excel file, select the Export to Excel option when creating the report.
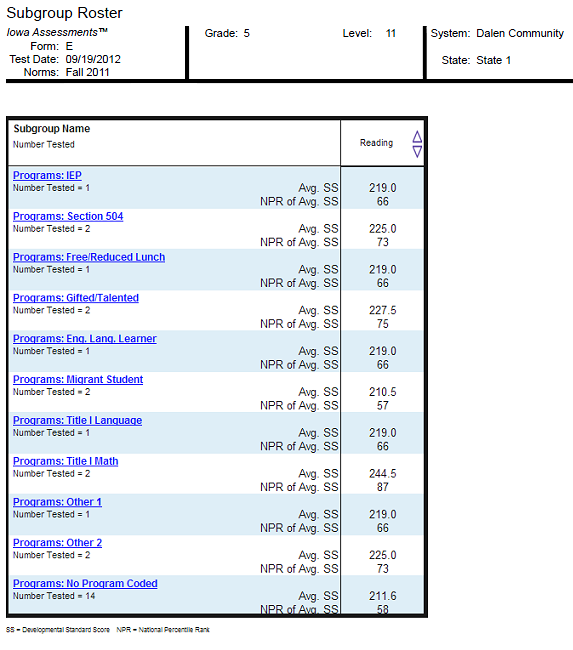
Subgroup Roster
(CogAT, GMRT, Iowa, and Interim Assessments)
The Subgroup Roster provides scores for all subgroups or a selected subgroup—gender, federal race/ethnicity, programs, and/or administrator codes. For Iowa Assessments and CogAT, the scores are provided by test or composite. For GMRT, the scores are provided by test or skill domain. For Riverside Interim Assessments, the scores are provided by test, skill domain, or cognitive level. The top of each page of the Subgroup Roster provides the report scope and test information, including some or all of the following: assessment, form, test date, norms, grade, level, class, building, district, system, region, and state.
Subgroups are displayed by row. The name of each subgroup is shown in the first column; the next column provides the subgroup's selected score(s) for the test, composite, skill domain, or cognitive level. Under each Subgroup Name, the number of students tested in that subgroup is provided.
Note: Data in this sample are for illustrative purposes only.
Group Profile
The following group profiles are available for the assessments specified in parentheses:
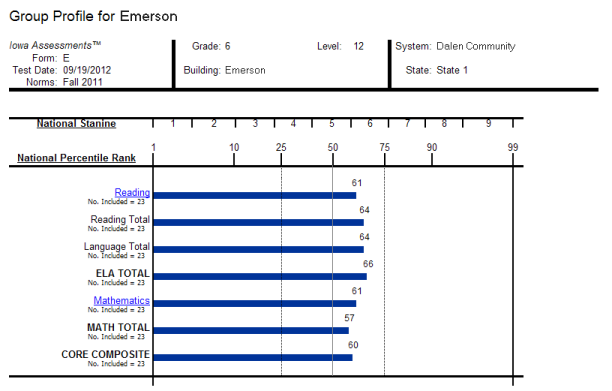
- Bar Graph (all)
The Group Profile —Bar Graph provides a bar graph displaying the average scores by test and composite or by skill domain for the selected group(s)—class, building, district, system, region, or state. For each Group Profile, the results are the combined average of the highest group level selected when you create the report. For example, if you select the Building level, the average score will be the combined average for the selected classes in the Building.
The top of each page of the report provides the report scope and test information, including some or all of the following: group, assessment, form, test date, norms, grade, level, class, building, district (if applicable), system, region (if applicable), and state.
Under each test name, the number of students whose scores were used to calculate the average score is shown. (This number may vary from the total number of students tested. For details, refer to “Exclude Scores from Group Averages” in the Supplemental Coding Guide available through DataManager.)
Note: For Iowa Assessments™ and Logramos® reports, you can click any of the blue underlined links to open a related skill analysis report
Note: Data in this sample are for illustrative purposes only.
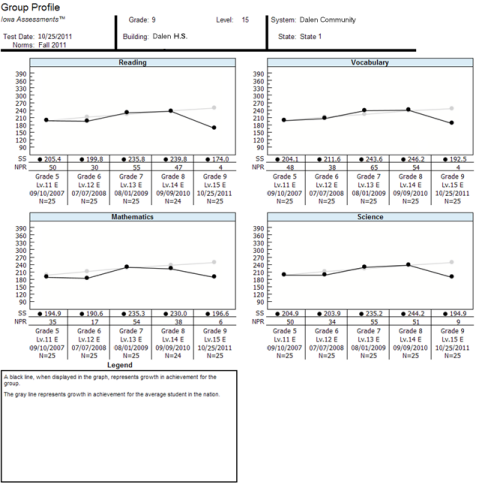
- Longitudinal Line Graph (all)
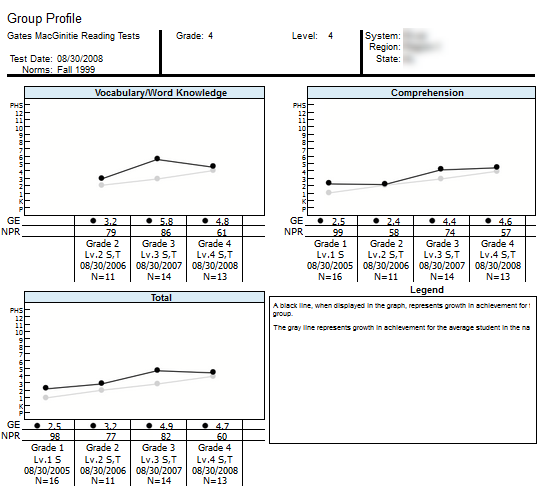
The Group Profile — Longitudinal Line Graph displays a series of line graphs showing the average test and composite scores of a specified group of students over time for up to five test administrations. For comparison purposes, the GMRT, Iowa and Logramos graphs also display a gray line representing the growth in achievement for the average student in the nation over the same period of time.
This image shows a Longitudinal Line Graph report for ninth-graders going back four years. The example uses Iowa Assessments at the building level.
The image below shows a Longitudinal Line Graph report for fourth-graders taking GMRT going back three years. (In the case of Vocabulary/Word Knowledge, the graph goes back only two years because that category is not on the Level 1 test.)
Note: Data in this sample are for illustrative purposes only.
- NEW Estimated Growth Summary, Early School Closure Edition (Iowa Assessments only)
The Estimated Growth Summary, Early School Closure (ESC) Edition, provides two points of comparison for students in each content area that you select: the estimated growth summary for students in a typical school year (TSY) versus the estimated growth for students with the ESC factored in.
Important: Students must have tested at least once during the 2018-2019 school year and once since QM 25 2020 (March 8-15, 2020) to make this report available.
For each Content Scope that you have selected for the report, the number and percentage of students scoring within the TSY estimated growth versus the ESC estimated growth appears on a color-coded bar graph. The number of months delayed is indicated along the bottom row of the report. Student scores are paired as TSY and ESC in blocks of months delayed, from 0 months delay to 1-3 months, 4-6 months, 7-10 months, and over 10 months delay.
In the example below, the TSY estimate for the 4-6-month growth delay segment equals 11% or one student, whereas the adjusted growth delay predicts twice that number (22% or two students).
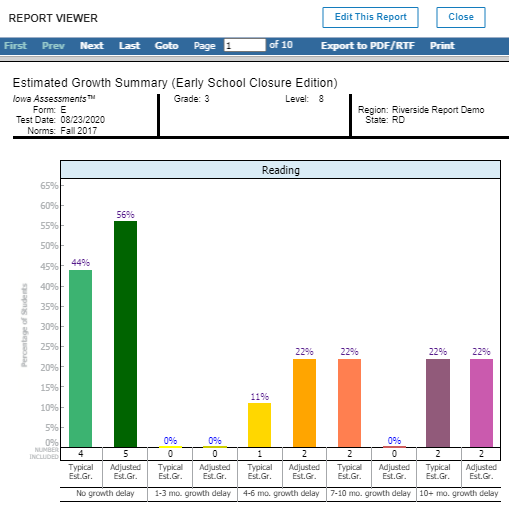
To view a Student Roster report for one of the segments, click the percent number at the top of the bar.
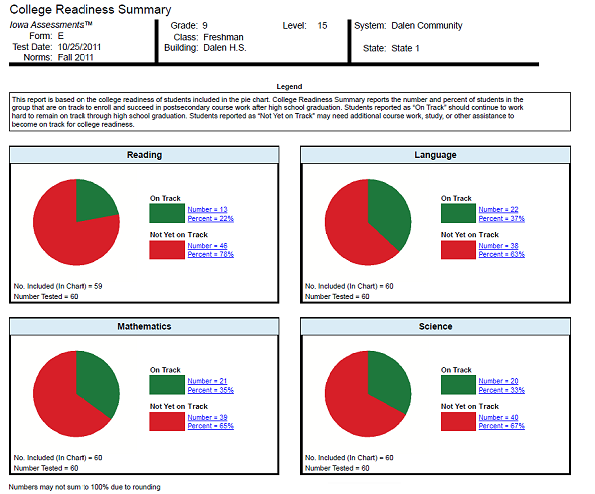
- College Readiness Summary (Iowa Assessments only)
The Group Profile—College Readiness Summary displays pie charts showing the number and percent of the students in the group that are on track to enroll and succeed in post-secondary coursework. This option is available for Grades 6–12. The report displays charts for each of the selected college readiness test options, which includes Reading, Language, Mathematics, and Science.
College Readiness is determined by mapping the predicted ACT® score range, which is estimated using Iowa Assessments test results, with defined targets of readiness as determined by ACT College Readiness Benchmarks.
Within the chart of any test, you can click the Number or Percent link for either group of students— On Track or Not Yet on Track —to open the Student Roster for that group of students.
Note: Data in this sample are for illustrative purposes only.
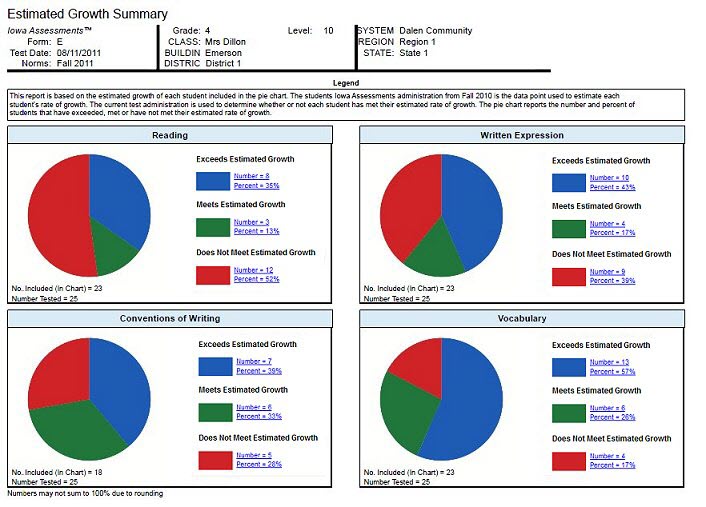
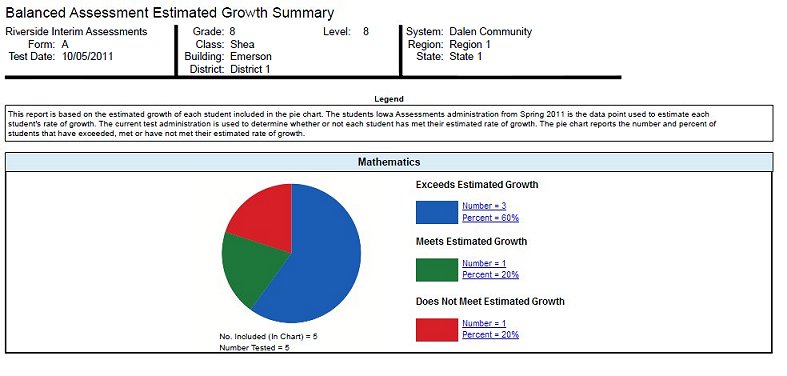
- Estimated Growth Summary (Iowa Assessments only)
The Group Profile—Estimated Growth Summary provides pie charts for each content area displaying the number and percent of the students in the group that exceed, meet, or do not meet an estimated rate of growth. For each student in the group, the test and composite results of the current test administration are compared to a previous Iowa Assessments test administration to determine if that student met the estimated rate of growth. The results for all students in the group are combined to provide the group total. Note that only those students who took the current and previous test administrations are included in the group totals displayed in each pie chart.
Within the chart of any test, you can click the Number or Percent link for any group of students— Exceeds Estimated Growth, Meets Estimated Growth, or Does Not Meet Estimated Growth —to open the Student Roster for that group of students.
Note: Data in this sample are for illustrative purposes only.
- Balanced Assessment Estimated Growth Summary (Interim Assessments only)
The Group Profile—Balanced Assessment Estimated Growth Summary provides a pie chart displaying the number and percent of the students in the group that exceed, meet, or do not meet an estimated rate of growth. For each student in the group, the results of the current Riverside Interim Assessments test administration are compared to a previous Iowa Assessments test administration to determine if that student met the estimated rate of growth. The results for all students in the group are combined to provide the group total. Note that only those students who took the current and previous test administrations are included in the group total displayed in the pie chart.
Within the chart, you can click the Number or Percent link for any group of students— Exceeds Estimated Growth , Meets Estimated Growth , or Does Not Meet Estimated Growth —to open the Student Roster for that group of students.
Note: Data in this sample are for illustrative purposes only.
- Progress Monitoring Line Graph (Interim Assessments only)
The Group Profile—Progress Monitoring Line Graph allows you to track the progress of a group by skill domain for up to three test administrations taken within the year.
Note: Data in this sample are for illustrative purposes only.
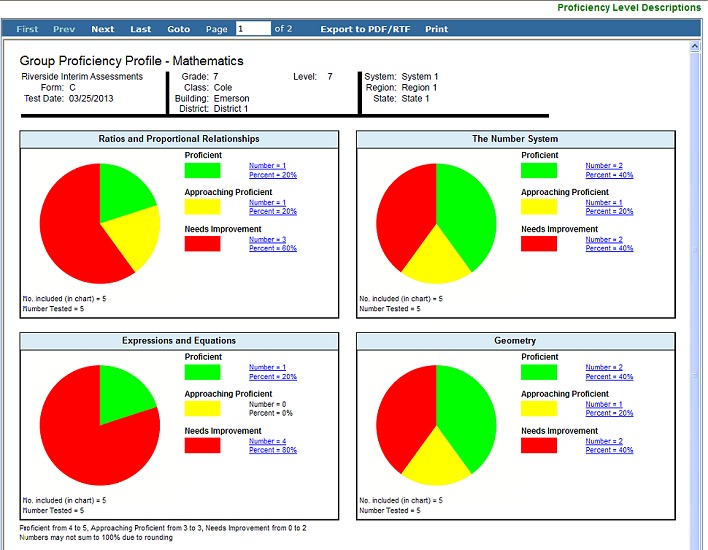
- Proficiency Profile (Interim Assessments only)
The Group Proficiency Profile displays pie charts showing the number and percent of the students in the group that are included in predetermined proficiency ranges, based on test results or skill domain scores. Using the PERFORMANCE BANDS option, you can customize the color-coded proficiency value ranges and labels, or you can use the default ranges and labels. Default values differ by test and level. For a complete list of default ranges, see Recommended Proficiency Cut Scores. A footnote is provided at the bottom of the report identifying the labels and value ranges assigned for the report. The Proficiency Level Descriptions link in the upper right corner of the page allows you to open a document containing a complete list of proficiency level descriptions by grade.
Within a chart, you can click the Number or Percent link for any proficiency band of students to open the Student Roster for that group of students.
Note: Data in this sample are for illustrative purposes only.
GMRT only
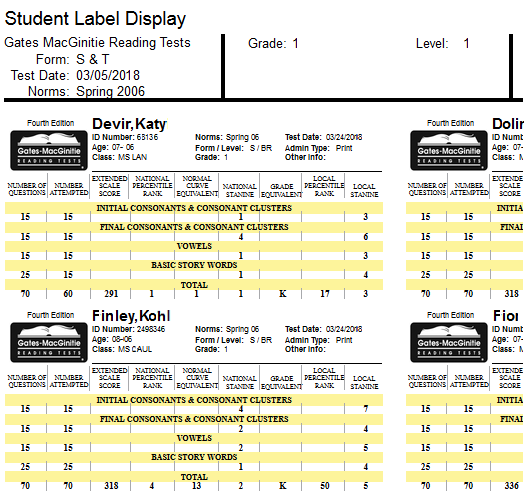
- Student Label
Creates labels for printing and attaching to student files. The header information includes the student's name and ID, age, class, test level and date, and normative year. The body of the label includes the test results that you select when you run the report.
The report output can be printed on Avery labels (available at most online and brick-and-mortar office supply stores).
Note: Data in this sample are for illustrative purposes only.
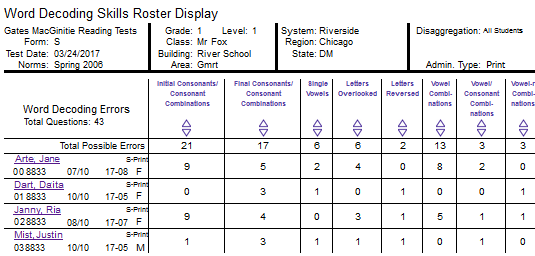
- Word Decoding Skills Roster
The Word Decoding Skills Roster report shows the number and category of errors made by class on the Word Decoding subtest of GMRT Level 1 (form S) and Level 2 (form S and form T). The alphabetical list of students allows for various sorting and filtering options such as sorting by number of errors (from high to low or low to high) and filtering for the number of errors above, below, or between a specified number. For information on applying filters to this report, see the instructions for running the report (in the list of reports, step 4 of Create Gates-MacGinitie Reading Test Reports).
Note: Data in this sample are for illustrative purposes only.
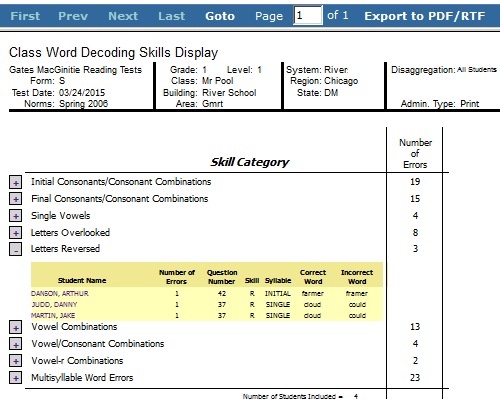
- Class Word Decoding Skills
The Class Word Decoding Skills report provides the overall number of errors made by a class on each of the Skills in GMRT Level 1 (form S) and Level 2 (form S and form T).
Note: Data in this sample are for illustrative purposes only.
- Student Word Decoding Skills
The Student Word Decoding Skills report shows a student's errors, per skill category, on the Word Decoding subtest of GMRT Level 1 (form S) and Level 2 (form S and form T). When setting report parameters, you can select a single student or an entire class with a page for each student, as indicated in the blue navigation menu below (Page 1 of 14).
Skill Categories can be expanded to see the exact errors students made on the subtest, as in the Vowel Combinations expanded in the image below.
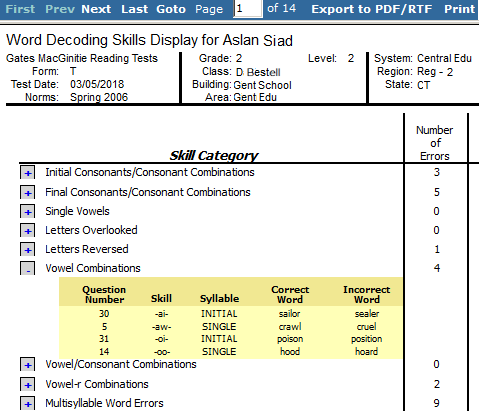
Note: Data in this sample are for illustrative purposes only.
Scoring Service Print Style (CogAT, Iowa Assessments, and Logramos only)
- List of Student Scores (CogAT, Iowa Assessments, and Logramos)
The List of Student Scores report provides the test and composite scores for each student in the selected group(s). The top portion of the report provides the report scope and test information, such as assessment, test date, norms, grade, class, building, district (if applicable), system, region (if applicable), and state. The first column of the report lists each student by name and includes some or all of the following: student ID, birth date, age at testing, form, level, and gender. The remaining columns provide the student's test and composite scores.
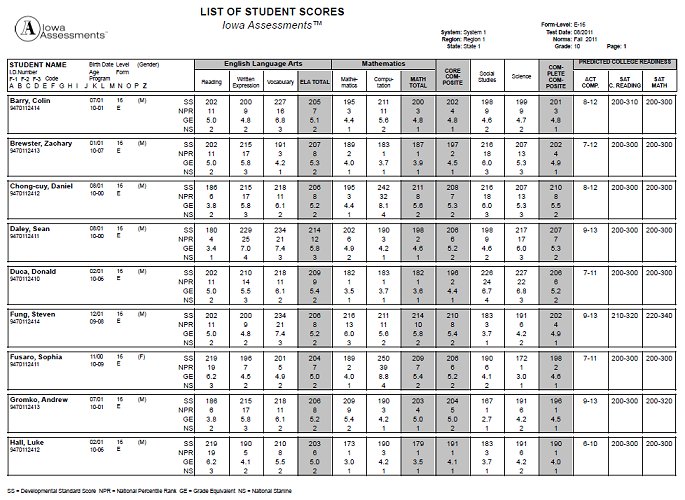
Note: Data in this sample are for illustrative purposes only.
- Student Profile Narrative (CogAT, Iowa Assessments, and Logramos)
The Student Profile Narrative report provides a table of each individual student's scores, a graph of the student's NPR (for Iowa Assessments ) or APR (for CogAT), and a narrative overview of how to interpret and use the scores to assist in the student's educational development. The top portion of the report provides the student name, class name, report scope, and test information, such as assessment, test date, norms, grade, building, district (if applicable), system, region (if applicable), and state.
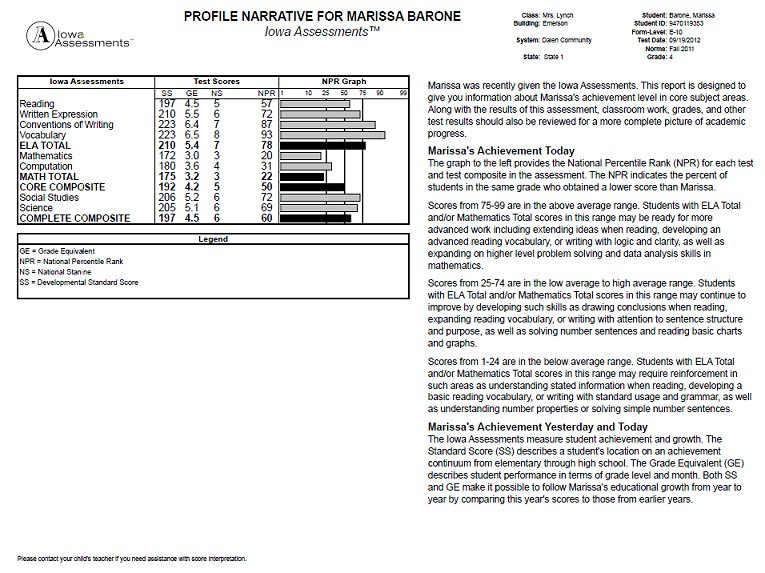
Note: Data in this sample are for illustrative purposes only.
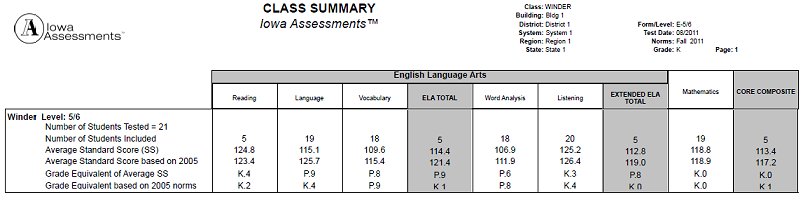
- Group Summary (CogAT, Iowa Assessments, and Logramos)
The Group Summary report presents the average scores for a selected group. The top portion of the report provides the group or class name, report scope, and test information, such as assessment, test date, norms, grade, building, district (if applicable), system, region (if applicable), and state. The first column of the report lists the number of students in the group and the scores selected to appear on this report. The remaining columns list the average test and composite scores for the group.
Note: Data in this sample are for illustrative purposes only.
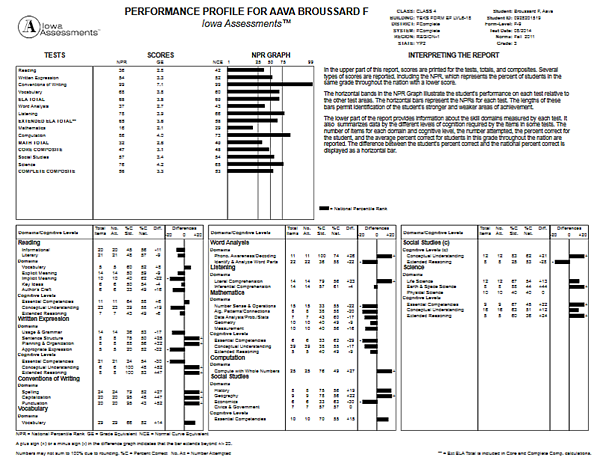
- Individual Performance Profile (Iowa Assessments and Logramos only)
The Individual Performance Profile report (IPP) produces a student skill-level report as a PDF from the DataManager Report Center.
The report displays a student's scores on individual tests with bar graph (with or without Confidence Band) representing National Percentile Rank (default) and/or Local Percentile Rank (if ordered at the time of scoring). The bottom table displays domain and cognitive-level scores with graphs of Difference measures.
Note: Data in this sample are for illustrative purposes only.
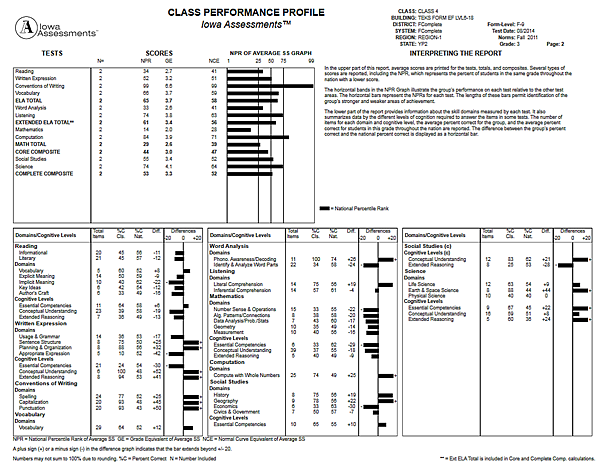
- Group Performance Profile (Iowa Assessments and Logramos only)
The Group Performance Profile (GPP) report provides a summary of test and domain scores for a class, for grade groups in a building, or for an entire school system. The report includes an average score profile and a graph displaying the National Percentile Rank (NPR) for each test taken. The bottom table shows comparative values for domains and cognitive levels.
Note: Data in this sample are for illustrative purposes only.
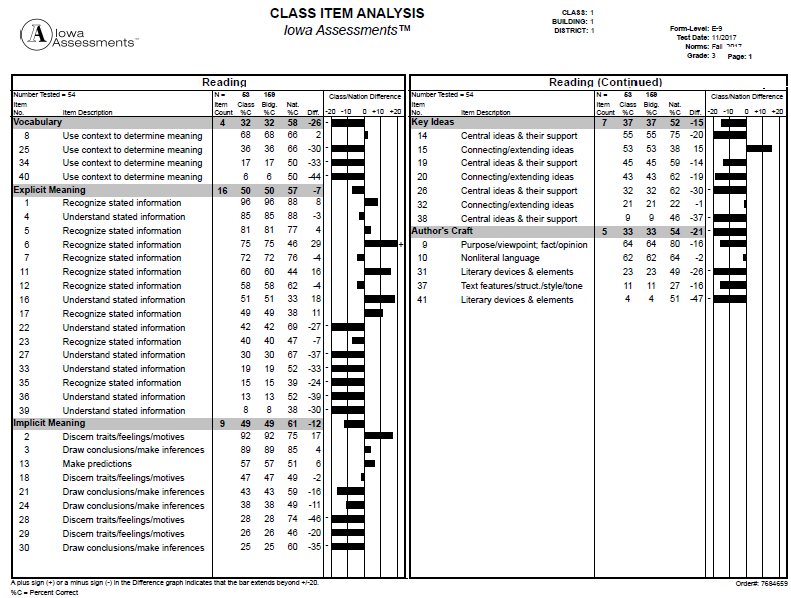
- Group Item Analysis (Iowa Assessments and Logramos only)
This report provides the Iowa Assessments or Logramos percent-correct scores for each item on a test, sorted by skill domains. It displays the average performance of the group (in this case, a class) and compares it to the average national performance in addition to 1-2 groups (for example, a district and/or a building) of the user's choosing (at run-time).
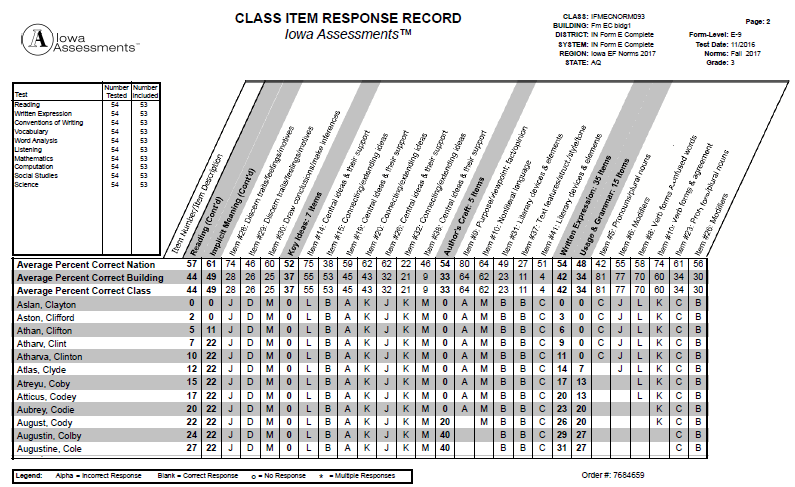
- Class Item Response Record (Iowa Assessments and Logramos only)
This report displays each student's response to every test item on an Iowa Assessments or Logramos test. By default, it also shows the national average of percent-correct scores. Users can select an additional group by which to compare individual student responses (such as a building or a district). The report contains two parts, Class Item Response Record and Class Item Response Summary.
Important: Due to the scope and granularity of item-level data, this report takes longer to run. Additionally, it renders multi-page results in a single PDF file. Please consider the optimal size of your PDF file before running the report.
Create Iowa Assessments Reports