
The NEW Student Roster — Estimated Growth Report, Early School Closure (ESC) Edition, compares a student's original estimated growth trajectory to a new trajectory that reflects Covid-19-related school closures. The ESC trajectory assumes zero growth from quartermonth 25 (QM 25, March 8 - 15, 2020).
Comparing estimated student growth (ESG) for a typical school year (TSY) with growth for the early school closures (ESC) can help you determine:
- The impact of school closures on students' academic growth
- The efficacy of distance learning programs per grade, content, and/or location (class, school, district, region)
- Different impacts on different student populations
Note: In order to have this report available to you, your students must have tested at least once during the 2018-19 school year and once since the school shutdown (QM 25).
The report heading provides the report type, the test (Iowa Assessments is required for this report) and form, the test date, and the norms being used for scoring. The center bracket shows the grade and level, the right bracket the location. The total number of students tested appears just below the heading, directly above the table of scores.
Based on the heading below, testing for the Student Roster ESC Edition took place on August 1st, 2020 using Iowa Assessments Form E and Fall 2017 norms. 1,479 fifth-graders across Region-1 of the state were tested.
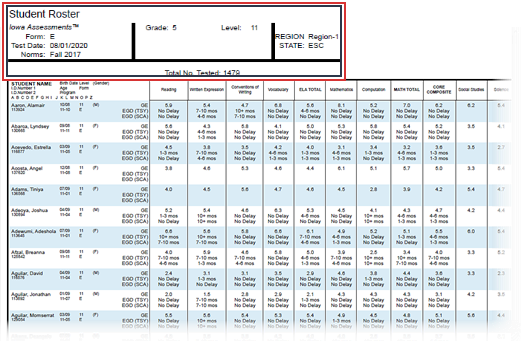
The report itself, for each student, displays a student's name and ID number, secondary student ID (if applicable), birth date, age, and gender, and test level and form. The remaining columns in the table provide the student's scores for each test and composite.
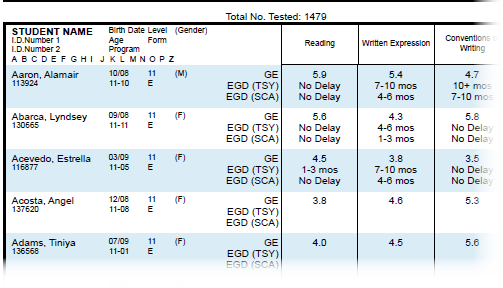
The New Student Roster report displays three scores:
- GE: the grade equivalent of the student's score on the assessment; fifth-grade students testing in August 2020 at level 11 Reading scored in a range of grade equivalencies, from above-grade (5.9 and 5.6, for the top two students shown in the table) to below-grade (4.5, 3.8, and 4.0, for the remaining three shown here).
- EGD (TSY): the estimated delay in growth of the student for a typical school year; both of the top two students had no growth delays for Reading, while the third student experienced a 1-3-month delay. (The bottom two students shown here did not participate in a past test event, so growth delay was not measurable.)
- EGD (SCA): the estimated delay in growth of the student, adjusted for early school closures; DataManager estimates zero growth from the time of most school closures, March 2020. Because growth is expected to flatten, these scores will always show a better outcome than those for a typical school year. As the table of scores above demonstrates, while the third student had a 1-3 month delay for EGD (TSY), the student scored above the adjusted growth delay. The difference is consistent for the Written Expression test scores, where the delay is greater for the TSY than for the SCA.