Group Roster

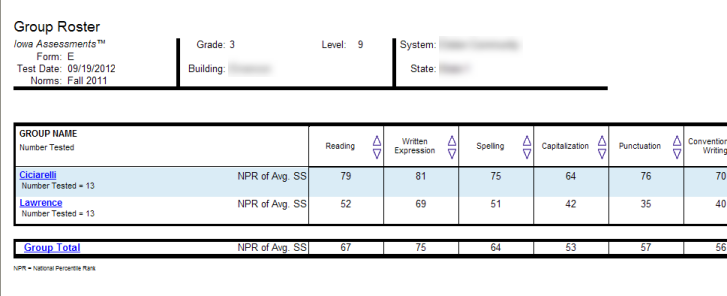
The Group Roster provides scores by test and composite or by skill domain and cognitive level for each selected group—class, building, district, system, or region. The top of each page of the Group Roster provides the report scope and test information, including some or all of the following: assessment, form, test date, norms, grade, level, class, building, district (if applicable), system, region (if applicable), and state.


Groups are displayed by row. The name of each group is shown in the first column; the remaining columns provide the group's score(s) for each test and composite. Under each Group Name, the number of students tested in that group is provided. The Group Total, displayed on the bottom row, provides the selected groups' average scores for each test and composite or skill domain and cognitive level.


You can click a group's name to open the Group Profile for that group or click Group Total at the bottom of the report to open a Group Profile that combines all the selected groups.


Note:  Group Rosters display a maximum of 25 groups per page.


Group Roster Item Response Summary (Riverside Interim Assessments only)


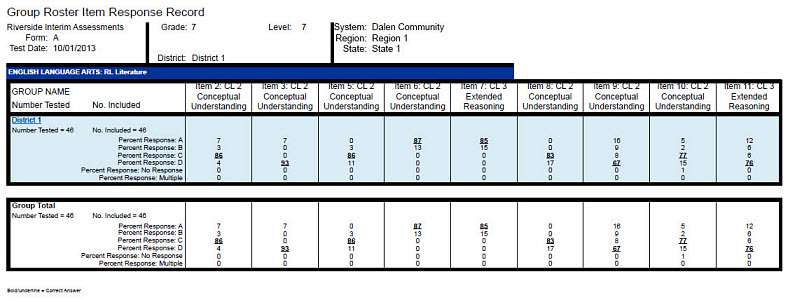
The web-display version of the Group Roster Item Response Summary identifies the test items used to measure each skill domain for each selected group—class, building, district, system, or region, and it provides the group results for each of these test items. Each selected skill domain is provided on a separate page of the report. The top of each page provides the report scope and test information, including some or all of the following: assessment, form, test date, grade, level, class, building, district (if applicable), system, region (if applicable), and state.


The blue bar at the top of the report table provides the skill domain for which results are being reported. Each test item that is used to measure this skill domain is provided as a separate column. The column header provides the test item number as well as the cognitive level that is measured using this test item. Groups are displayed by row. The name of each group is shown in the upper left corner of the first cell in each row. Directly below the group name is the number of students tested in this group followed by the number of students whose scores are included in the group scores. Possible responses are listed on the left side of the first cell, and the percentage of the group that selected each response is provided in the remaining columns. The percentage representing the correct response for a given test item is displayed in bold and underlined text.


The Group Total, displayed on the bottom row, provides the selected groups' average scores.


You can click a group's name within the report to open the Student Roster Item Response Record for that group.


Note:  This report is also available as an Excel export file. To download as an Excel file, select the Export to Excel option when creating the report.


Field

Selections

Description

GRADE/LEVEL

Iowa: grades K - 12 and corresponding levels

Logramos: grades K - 8 and corresponding levels

Any listed combination of grade, test level, and, if available, subject or battery.

Only those grades and levels that were tested are available for selection

LEVEL OF ANALYSIS


  • Test and Composite Analysis (TC)
  • Skill Domain Analysis (SD)

TC analyzes scores by test and composite; selecting this creates the Composite Calculation Options field.

SD analyzes scores by skill domains and cognitive levels; selecting this creates the SKILL DOMAIN CLASSIFICATION field.

SKILL DOMAIN CLASSIFICATION

(Skill Domain Analysis only)

For Iowa:

  • Common Core State Standard Domains
  • Iowa Assessment Domains
  • Texas Essential Knowledge and Skills (Texas only)

For Logramos:

  • Logramos Domains

Determines which classification domain (for example, Common Core State Standard Domains) is used to define and group skills.

Impacts SUB CONTENT SCOPE options below.

SCORE(S)

Click analysis level to view list:

For Test and Composite Analysis(TC)

For Skill Domain Analysis (SD)

Differs TC to SD; click to view the options. For additional information about a field, see Score Descriptions for Iowa or Logramos.

Click to select or clear any of the scoring factors that appear for your report.

Note: Only factors that apply to composite calculation options for this report type are available.

Include Students Coded in Office Use:

Refers to the "Office Use Only" section of a student answer document. Identifies students whose test scores should be included (Overrides exclusions; those test scores marked for exclusion will be used in computing group averages.) or excluded (Test scores marked for exclusion will not be used in computing group averages; those test scores will be reported on individual student score reports.) from group averages.

  • Include Math Computation in Math Total
  • Include Extended ELA Scores in Core and Complete Composite Calculation

CONTENT SCOPE

1 or more available skill areas:

  • Reading Words
  • Reading Comprehension
  • Reading
  • Written Expression
  • Spelling
  • Capitalization
  • Punctuation
  • Conventions of Writing
  • Language
  • Vocabulary
  • READING TOTAL
  • LANGUAGE TOTAL
  • ELA TOTAL
  • Word Analysis
  • Listening
  • EXTENDED ELA TOTAL
  • Mathematics
  • Computation
  • MATH TOTAL
  • CORE COMPOSITE
  • Social Studies
  • Science
  • Information Literacy
  • COMPLETE COMPOSITE

Select one or more to view targeted skills on the report. (You may not see all of the selections listed here, depending on your previous selections for Assessment, LEVEL OF ANALYSIS, and GRADE/LEVEL.)

SUB CONTENT SCOPE  (Skill Domain Analysis only)

A list of narrower target areas derived from the previous CONTENT SCOPE selections.

Options differ depending on GRADE/LEVEL and SKILL DOMAIN CLASSIFICATION selections.

REGION/SYSTEM/DISTRICT/ BUILDING/CLASS

  • All (default)
  • Specific location

Determines the population scope of your report. The field name depends on your setup and permissions (for example, BUILDING if you are a Building or School Administrator).

If you select a specific location, a new sub-level field opens below. This continues for all available locations (down to the level of CLASS).

POPULATION FILTERS

4  categories, 1 selection allowed for each

  • Gender
  • Federal Race Ethnicity
  • Programs
  • Administrator Codes

Narrows results by gender, ethnicity, program (such as IEP or Gifted), and/or administrative code.

SCORE FILTERS

Instructions

Narrows results based on number correct or percentile scores.


Score Filters

a.    For the SCORE FILTERS field, click Change. The filter box appears with filter options available for the report. These options vary depending on the type of report.

b.    In the SCORE list, select the specific score type to use as a filter for the test results.

Note: Lexile is not available for filtering because it is represented by a range.

c.    In the CONTENT AREA list, select one of the skill domains.

d.    Select a relational operator (is equal to, is greater than, for example) from the COMPARISON list and type a VALUE in the box.

e.    (Optional) Specify one or two additional filters by selecting AND or OR in the AND/OR list and repeating steps b - d.

Note:  Selecting AND adds the additional filter requirement to the previous filter(s); the results contain only those values that meet both filter requirements. (For example: If your filter states “greater than 40 AND less than 50,” then the results include only values between 41 and 49.) Selecting OR includes the additional filter results together with the results of the previous filter(s); the results contain those values that meet either of the filter requirements. (For example: If your filter states “greater than 90 OR less than 10” on a scale of 0 to 99, then the results include values 91 to 99 and values 0 to 9.)

f.      Click Apply to apply the filters to the report. To remove or cancel the filter(s), click Cancel.

©2020 Riverside Assessments