
The following group profiles are available for the assessments specified in parentheses:
Bar Graph (all)
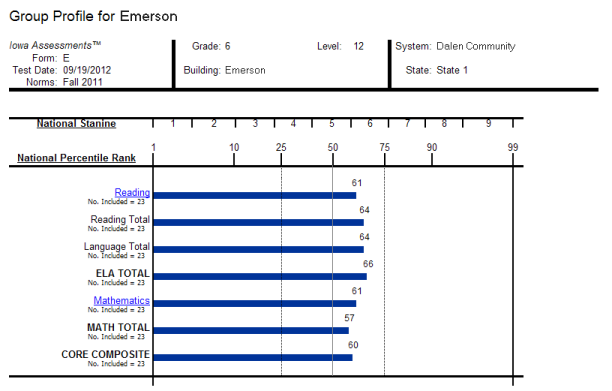
The Group Profile —Bar Graph provides a bar graph displaying the average scores by test and composite or by skill domain for the selected group(s)—class, building, district, system, region, or state. For each Group Profile, the results are the combined average of the highest group level selected when you create the report. For example, if you select the Building level, the average score will be the combined average for the selected classes in the Building.
The top of each page of the report provides the report scope and test information, including some or all of the following: group, assessment, form, test date, norms, grade, level, class, building, district (if applicable), system, region (if applicable), and state.
Under each test name, the number of students whose scores were used to calculate the average score is shown. (This number may vary from the total number of students tested. For details, refer to “Exclude Scores from Group Averages” in the Supplemental Coding Guide available through DataManager.)
Note: For Iowa Assessments™ and Logramos® reports, you can click any of the blue underlined links to open a related skill analysis report.
Note: Data in this sample are for illustrative purposes only.
Longitudinal Line Graph (all)
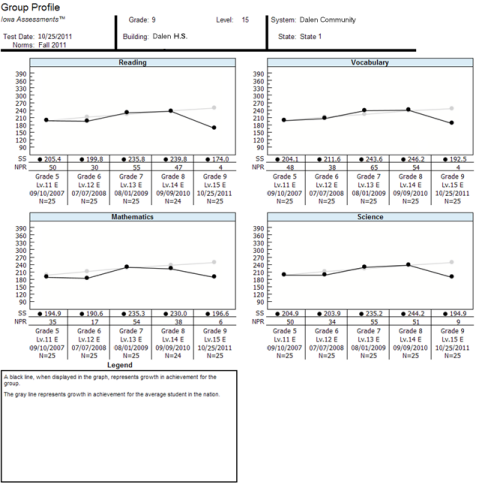
The Group Profile — Longitudinal Line Graph displays a series of line graphs showing the average test and composite scores of a specified group of students over time for up to five test administrations. For comparison purposes, the GMRT, Iowa and Logramos graphs also display a gray line representing the growth in achievement for the average student in the nation over the same period of time.
This image shows a Longitudinal Line Graph report for ninth-graders going back four years. The example uses Iowa Assessments at the building level.
The image below shows a Longitudinal Line Graph report for fourth-graders taking GMRT going back three years. (In the case of Vocabulary/Word Knowledge, the graph goes back only two years because that category is not on the Level 1 test.)
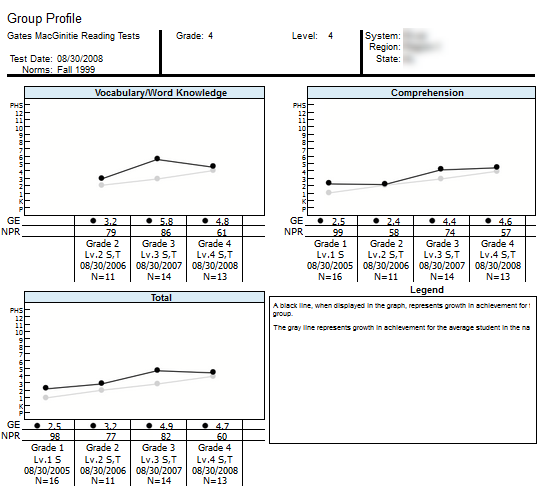
Note: Data in this sample are for illustrative purposes only.
NEW Estimated Growth Summary, Early School Closure Edition (Iowa Assessments only)
The Estimated Growth Summary, Early School Closure (ESC) Edition, provides two points of comparison for students in each content area that you select: the estimated growth summary for students in a typical school year (TSY) versus the estimated growth for students with the ESC factored in.
Important: Students must have tested at least once during the 2018-2019 school year and once since QM 25 2020 (March 8-15, 2020) to make this report available.
For each Content Scope that you have selected for the report, the number and percentage of students scoring within the TSY estimated growth versus the ESC estimated growth appears on a color-coded bar graph. The number of months delayed is indicated along the bottom row of the report. Student scores are paired as TSY and ESC in blocks of months delayed, from 0 months delay to 1-3 months, 4-6 months, 7-10 months, and over 10 months delay.
In the example below, the TSY estimate for the 4-6-month growth delay segment equals 11% or one student, whereas the adjusted growth delay predicts twice that number (22% or two students).
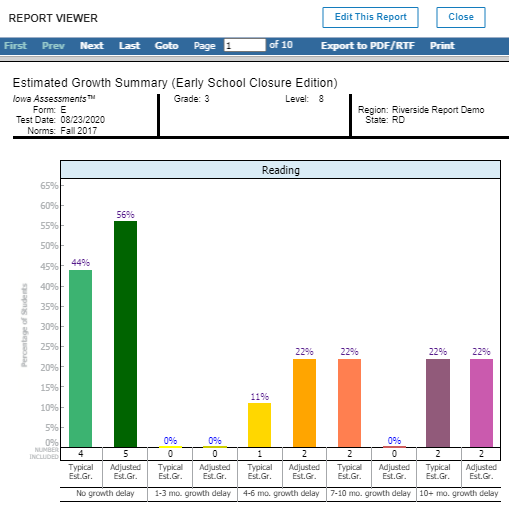
To view a Student Roster report for one of the segments, click the percent number at the top of the bar.
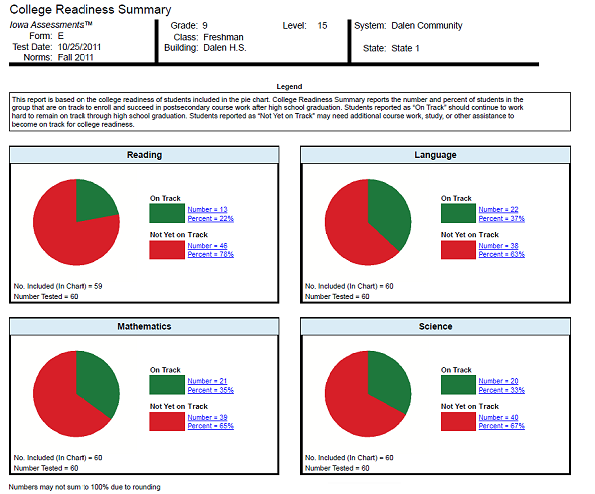
College Readiness Summary (Iowa Assessments only)
The Group Profile—College Readiness Summary displays pie charts showing the number and percent of the students in the group that are on track to enroll and succeed in post-secondary coursework. This option is available for Grades 6–12. The report displays charts for each of the selected college readiness test options, which includes Reading, Language, Mathematics, and Science.
College Readiness is determined by mapping the predicted ACT® score range, which is estimated using Iowa Assessments test results, with defined targets of readiness as determined by ACT College Readiness Benchmarks.
Within the chart of any test, you can click the Number or Percent link for either group of students— On Track or Not Yet on Track —to open the Student Roster for that group of students.
Note: Data in this sample are for illustrative purposes only.
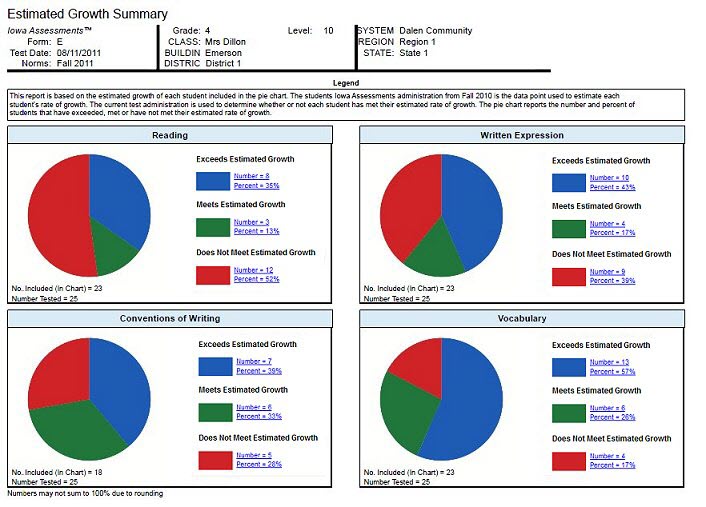
Estimated Growth Summary (Iowa Assessments only)
The Group Profile—Estimated Growth Summary provides pie charts for each content area displaying the number and percent of the students in the group that exceed, meet, or do not meet an estimated rate of growth. For each student in the group, the test and composite results of the current test administration are compared to a previous Iowa Assessments test administration to determine if that student met the estimated rate of growth. The results for all students in the group are combined to provide the group total. Note that only those students who took the current and previous test administrations are included in the group totals displayed in each pie chart.
Within the chart of any test, you can click the Number or Percent link for any group of students— Exceeds Estimated Growth, Meets Estimated Growth, or Does Not Meet Estimated Growth —to open the Student Roster for that group of students.
Note: Data in this sample are for illustrative purposes only.
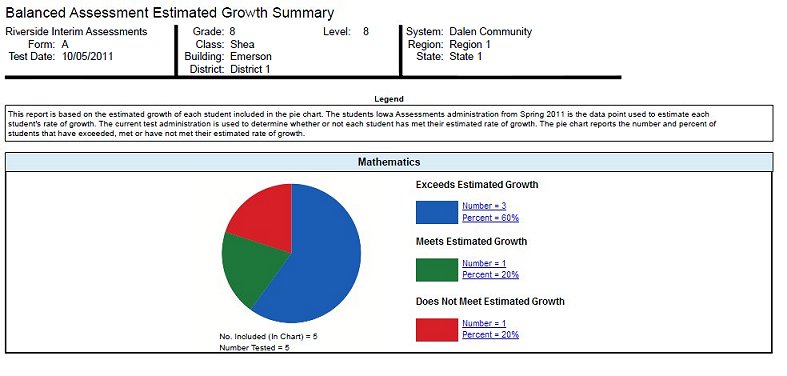
Balanced Assessment Estimated Growth Summary (Interim Assessments only)
The Group Profile—Balanced Assessment Estimated Growth Summary provides a pie chart displaying the number and percent of the students in the group that exceed, meet, or do not meet an estimated rate of growth. For each student in the group, the results of the current Riverside Interim Assessments test administration are compared to a previous Iowa Assessments test administration to determine if that student met the estimated rate of growth. The results for all students in the group are combined to provide the group total. Note that only those students who took the current and previous test administrations are included in the group total displayed in the pie chart.
Within the chart, you can click the Number or Percent link for any group of students— Exceeds Estimated Growth , Meets Estimated Growth , or Does Not Meet Estimated Growth —to open the Student Roster for that group of students.
Note: Data in this sample are for illustrative purposes only.
Progress Monitoring Line Graph (Interim Assessments only)
The Group Profile—Progress Monitoring Line Graph allows you to track the progress of a group by skill domain for up to three test administrations taken within the year.
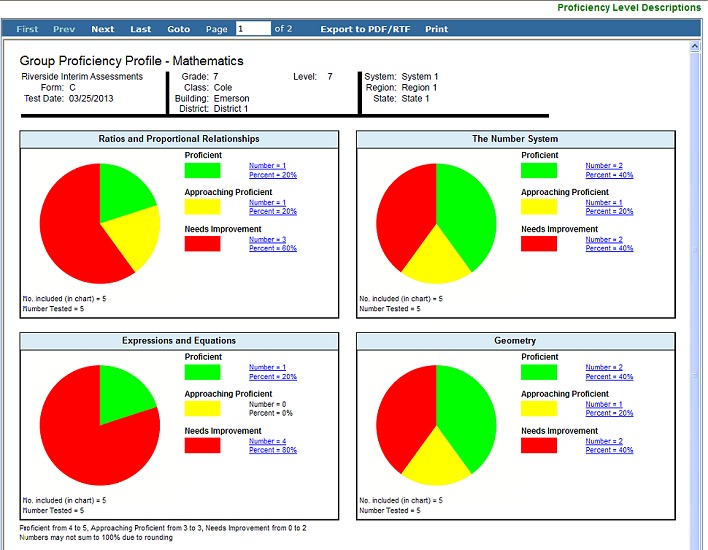
Proficiency Profile (Interim Assessments only)
The Group Proficiency Profile displays pie charts showing the number and percent of the students in the group that are included in predetermined proficiency ranges, based on test results or skill domain scores. Using the PERFORMANCE BANDS option, you can customize the color-coded proficiency value ranges and labels, or you can use the default ranges and labels. Default values differ by test and level. For a complete list of default ranges, see Recommended Proficiency Cut Scores. A footnote is provided at the bottom of the report identifying the labels and value ranges assigned for the report. The Proficiency Level Descriptions link in the upper right corner of the page allows you to open a document containing a complete list of proficiency level descriptions by grade.
Within a chart, you can click the Number or Percent link for any proficiency band of students to open the Student Roster for that group of students.
Note: Data in this sample are for illustrative purposes only.
|
Field |
Selections |
Description |
|
|
GRADE/LEVEL |
Iowa: grades K - 12 and corresponding levels Logramos: grades K - 8 and corresponding levels |
Any listed combination of grade, test level, and, if available, subject or battery. Only those grades and levels that were tested are available for selection |
|
|
LEVEL OF ANALYSIS
|
|
TC analyzes scores by test and composite; selecting this creates the Composite Calculation Options field. SD analyzes scores by skill domains and cognitive levels; selecting this creates the SKILL DOMAIN CLASSIFICATION field. |
|
|
SKILL DOMAIN CLASSIFICATION (Skill Domain Analysis only) |
For Iowa:
For Logramos:
|
Determines which classification domain (for example, Common Core State Standard Domains) is used to define and group skills. Impacts SUB CONTENT SCOPE options below. |
|
|
DISPLAY OPTIONS |
Select 1:
|
Bar Graph is the only option if you selected Skill Domain Analysis for LEVEL OF ANALYSIS * Longitudinal Line Graph and NEW Estimated Growth Summary (Early School Closure Edition) create a required TEST ADMINISTRATIONS field below. |
|
|
SCORE(S) (Test and Composite Analysis only, not available for Estimated Growth Summary reports) |
Select 1: For Bar Graph
For Longitudinal Line Graph
|
DISPLAY OPTIONS determine available scores. No scores are available when display is set to Estimated Growth Summary or NEW Estimated Growth Summary (Early School Closure). For additional information about a score, see Score Descriptions for Iowa or Logramos. *GE: A decimal number that describes a student’s location on an achievement continuum in terms of grade and months at which the typical student received this score (for example, 2.2 is second grade and two months into that grade) **SS: A number that describes a student’s location on an achievement continuum with the scale based on the Iowa Assessments test subjects growth model |
|
|
|||
|
CONTENT SCOPE |
1 or more of the following:
|
Select one or more to view targeted skills on the report. (You may not see all of the selections listed here, depending on your previous selections for Assessment, LEVEL OF ANALYSIS, and GRADE/LEVEL.) |
|
|
SUB CONTENT SCOPE (Skill Domain Analysis only) |
A list of narrower target areas derived from the previous CONTENT SCOPE selections. |
Options differ depending on GRADE/LEVEL and SKILL DOMAIN CLASSIFICATION selections. |
|
|
REGION/SYSTEM/DISTRICT/ BUILDING/CLASS |
|
Determines the population scope of your report. The field name depends on your setup and permissions (for example, BUILDING if you are a Building or School Administrator). If you select a specific location, a new sublevel field opens below. This continues for all available locations (down to the level of CLASS). |
|
|
LONGITUDINAL TYPES |
|
Available if your DISPLAY OPTIONS selection is Longitudinal Line Graph. Select the option to view longitudinal scores for one grade or longitudinal scores for several consecutive grades. |
|
|
TEST ADMINISTRATIONS |
For longitudinal reports, up to five test administration(s); for NEW estimated growth summary (ESC), one in addition to the default selection |
The default selections are the two most recent test administrations, including the previously selected Test Administration Date (step 3), which is set as the growth end point for the reports. |
|
|
POPULATION FILTERS |
4 categories, 1 selection allowed for each.
|
Narrows results by gender, ethnicity, program (such as IEP or Gifted), and/or administrative code. |
|