
To run a district-level cut score report:
1. Set your dashboard filters to the TEST EVENT, GRADE/LEVEL, and BUILDING you want to include in your query. Select other filters as needed.
2. Click the filter icon on the cut scores box.
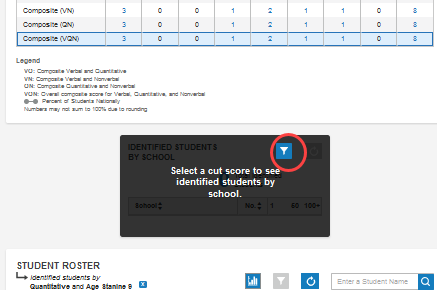
Note: The image above shows a view of the dashboard that shifts some items to accommodate a narrow screen display. This is known as a "responsive" layout, and all Riverside Insights® dashboards follow this adjustment.
The Select Report Criteria modal opens.
3. Enter parameters for your search on the lines provided. In the example below, a district administrator wants to create a learning program for top readers as measured by more than one score, and wants to include national rankings as well as local stanines. For the district-level report below, the Age Percentile Rank (APR) specifies students scoring in the highest 15% nationally combined with those scoring a local stanine of 8 or 9, roughly 10% of the district's highest-scoring students.
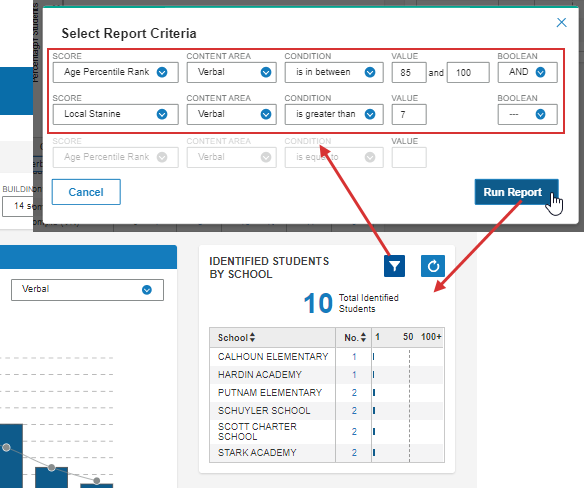
Ten students across six schools meet the qualifications for the reading program.