
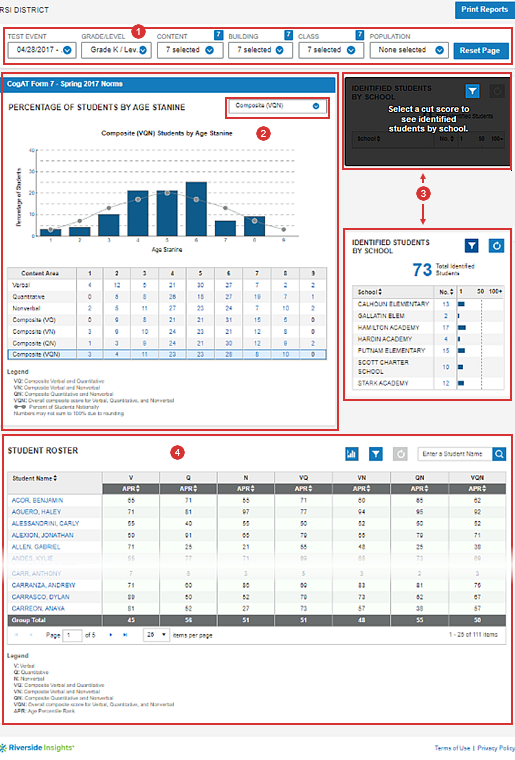
The CogAT dashboard presents four interdependent sections whose scope and default values vary according to the parameters of your test event and your role.
Note: For information and examples of reports based on roles, see Reports by Roles.
The layout of the dashboard remains fairly constant across different roles and the actions you perform on the data, with the exception of the cut score card (3, upper), which is available for district-level and building-level reports only.
Values within the sections change as you make changes to other sections. For example, if you change the TEST EVENT filter in section one (1) from the default (most recent) to one that occurred further in the past, the data in two (2), three (3, lower), and four (4) will change to reflect the results of the earlier test event.
Descriptions of the dashboard sections and their interactions with other controls on the dashboard can be found below:
Additional CogAT Dashboard Features
As with all Riverside Insights dashboard products, the CogAT dashboard includes a Print feature, available for all calibrations of the reports, and Legends below the Student Roster for all scores and abbreviations used in the tables.