
Building-level reports provide principals and curriculum administrators with tools to optimize learning programs in their schools.
To use the building-level dashboard report:
- Set filters to the population you want to search.
- Check the TEST EVENT date and name to ensure this is the correct test event for your report. The value defaults to the most recent test event.
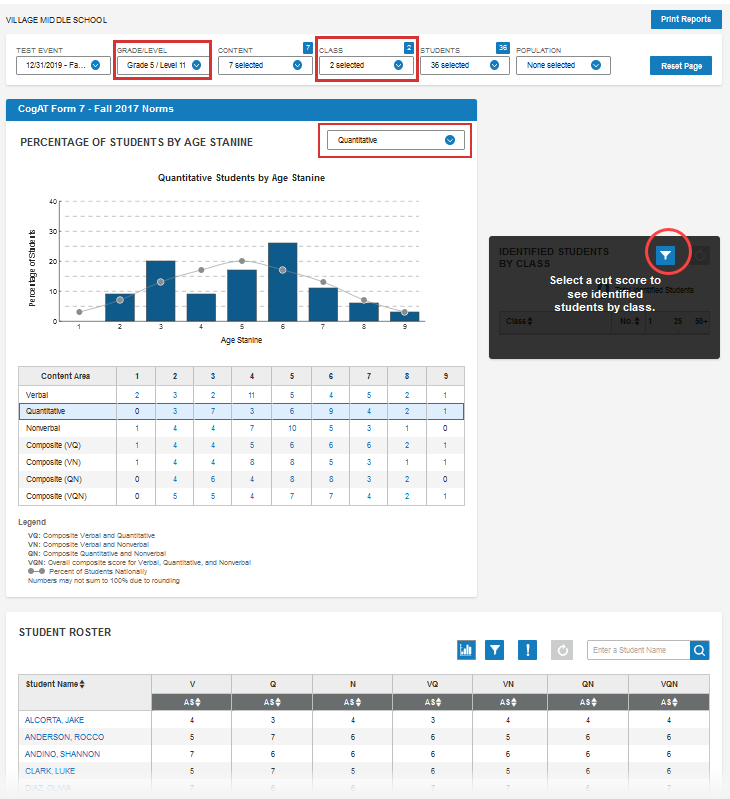
- Set the GRADE/LEVEL to those students whose results you want to view and parse. For example, if you want to create a math program for all fifth-graders in the school who scored below the average stanine, set the GRADE/LEVEL to 5/11 and the CLASS filter to Select all (in this example, the building contains two fifth-grade classes), then continue on with the selections below.
- (Optional): To narrow the test content to just the score you are reporting on, select that score in the CONTENT drop-down box. Otherwise, you can select the content you want to view in the summary box, as shown in Step 2.
- Select Quantitative on the PERCENTAGE OF STUDENTS BY AGE STANINE menu.
- Click the filter on the dark gray "cut score" box.
The Select Report Criteria modal opens. - Filter the search criteria to find students in your building who scored below the average quantitative stanine of 5.
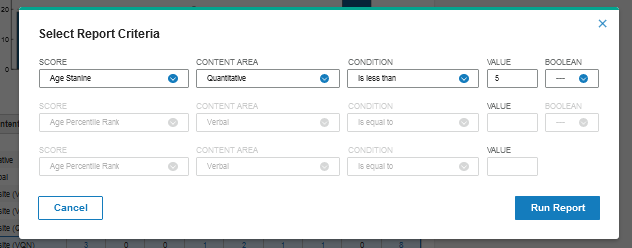
- Click Run Report.
The dashboard returns the classes and students that match your criteria.
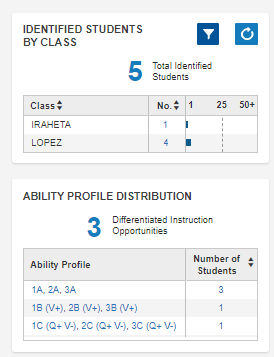
The lower table, the ABILITY PROFILE DISTRIBUTION table, shows which of those students fall into three identified Ability Profiles. The profiles suggest specific learning approaches laid out in CogAT's Differentiated Instruction Opportunities. See Ability Profiles and Differentiated Instruction Opportunities.