
Stanine (derived from "standard-nine") scores deliver a 1-9 scale of abilities based on national norm-based averages by age or grade. The distribution of scores places over 50% of students within the middle three score ranges (4-6), with decreasing percentages at the outer scores (that is, a score of 3 or 7 puts students up to 12% lower or higher, respectively, than the middle scores; scores 2 and 8 move the students up to 7% lower or higher than 3 and 7, and the remaining scores, 1 and 9, constitute the lowest and highest 1-4% of students.)
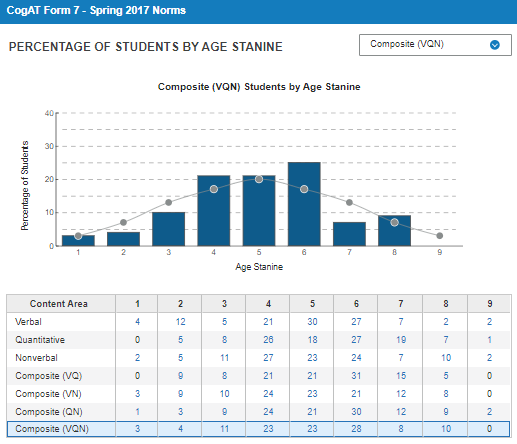
On the CogAT dashboard, an age-based stanine line graph overlays a bar graph that represents the actual scores of a group of students. The actual results, compared with the stanine model, indicate how teachers might group students for instruction. For example, students scoring at level 1 might benefit from small-group or one-on-one instruction for a portion of the class period, while students performing at the highest level (in the example above, 8 rather than 9) might benefit from more independent or peer activities.
Note: Because of these score ranges, stanines are ideal for placing students into small groups for targeted instruction. Furthermore, when combined with CogAT content and composite divisions and combinations, teachers can isolate areas for instruction and emphasis based on CogAT ability profiles. Riverside Insights® provides instructions for implementing educational aids through its Differentiatied Instruction Opportunities, available on its company web site.
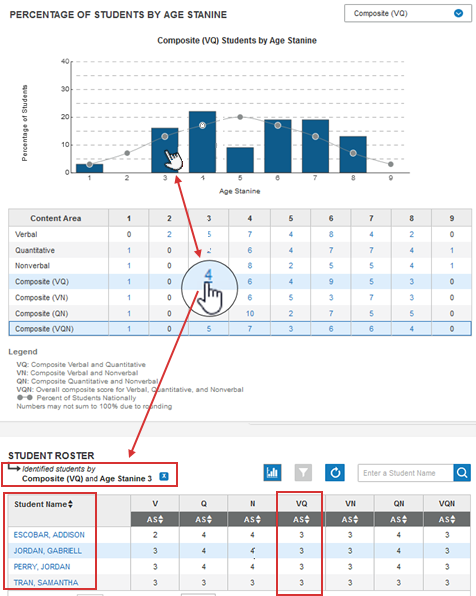
Scores reflected on the bar graph and Content Area table below it respond immediately to any changes you make in the filters or the internal menu (Composite (VQN) in the image above, Composite (VQ) in the image below).
Clicking any of the bars on the bar graph instantly updates the STUDENT ROSTER section at the bottom of the dashboard, showing only those students in that location, scoring in that stanine for that content.
Clicking any of the student numbers per stanine in the Content Area grid has the same effect. In the example below, four students scored 3 for the composite VQ. Selecting the bar graph for stanine 3 or the Content Area column 3, row Composite (VQ)—the number 4, for four students—produces age stanines for all content categories in the Student Roster section for the four students who scored 3 on the VQ.
Cut scores and ability profiles (not shown here) also adjust their numbers to reflect only the selected group.