-2.png?height=120&name=image%20(1)-2.png)
Allows you to create up to ten columns across multiple test administrations, test types, grades, and levels for each student in a selected group.
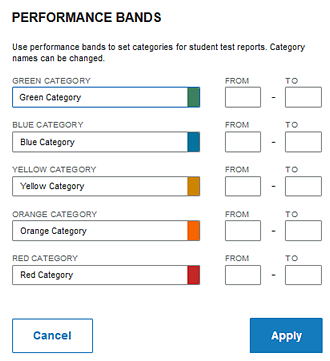
Allows you to create up to ten columns across multiple test administrations, test types, grades, and levels for each student in a selected group. A PERFORMANCE BANDS option allows you to specify performance indicator labels and values that color-code the test results for each student.
Default ranges appear for the SCORE(S) ISS-D ISS-T, but you can change them by typing different values.
The Multimeasure Student Roster allows you to create a multiple-column report (up to ten columns) that provides scores by test and composite or skill domain and cognitive level for multiple test administrations, test types, grades, and levels for each student in the selected group. This report also provides a PERFORMANCE BANDS option, which allows you to specify performance indicator labels and values that color code the test results for each student. For example, you could assign green to represent "proficient," yellow to represent "approaching proficiency," and red to represent "needs improvement." A footnote is provided at the bottom of the report identifying the labels and value ranges assigned for each column.
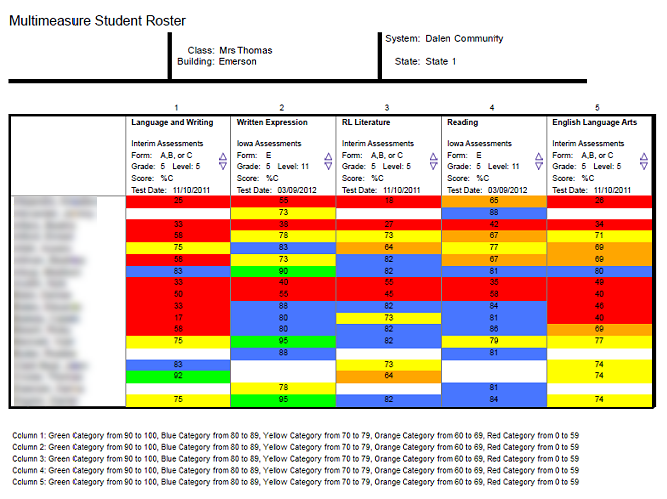
This report shows a five-column report for Interim Assessments.
The image below shows a three-column report for GMRT.
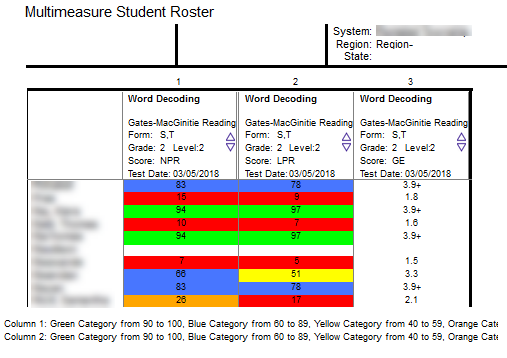
Note: Data in this sample are for illustrative purposes only.
View the table below with definitions for the remaining fields. When you have entered your report parameters, continue with the next step.
|
Field |
Selections |
Description |
|
|
GRADE/LEVEL |
Grades/Levels 2 - 11; Math, English Language Arts (ELA) |
Any listed combination of grade, test level, and, if available, subject or battery. Only those grades and levels that were tested are available for selection. |
|
|
LEVEL OF ANALYSIS
|
Skill Domain Analysis (SD) |
SD analyzes scores by skill domains and cognitive levels. This is the only option for the Multimeasure display of Interim Assessments. |
|
|
SKILL DOMAIN CLASSIFICATION |
Common Core State Standard Domains |
Determines which classification domain is used to define and group skills. Common Core is the only option for this report. |
|
|
SCORE(S) |
See SCORE FILTERS below for instructions on how to narrow results to students who scored at or within range of a certain number or percentile. |
||
|
CONTENT SCOPE |
● MATHEMATICS ● ELA |
Select one to view targeted skills on the report. Determines SUB CONTENT SCOPE options. |
|
|
SUB CONTENT SCOPE |
Varies by previous selections. |
A list of target areas to display on the report, derived from CONTENT SCOPE as well as GRADE/LEVEL. |
|
|
PERFORMANCE BANDS |
Allows you to display score ranges for students in a color-coded table. |
||
|
REGION/SYSTEM/DISTRICT/ BUILDING/CLASS |
● All (default) ● Specific location |
Determines the population scope of your report. The field name depends on your setup and permissions (for example, BUILDING if you are a Building or School Administrator). If you select a specific location, a new sublevel field opens below. This continues for all available locations (down to the level of CLASS). |
|
|
SCORE FILTERS |
Narrows results based on item or percentile scores. |
||
|
Add Column (button) |
Displays up to 10 columns with 10 variations of student roster reports. Fields that cannot be changed, such as the location field (for example, CLASS or BUILDING), are inactive as you create other columns with varying parameters. |
||
Scores
Percent Correct: Percent Correct (%C): The result of dividing the number of questions a student answered correctly on a test by the total number of test questions and then multiplying by 100
Raw Score: The number of questions a student answered correctly on a test
Interim Scaled Score for Tests (ISS-T): A number derived from the raw score for a test that describes a student’s location on an achievement continuum or scale for the test
Interim Scaled Score for Skill Domains (ISS-D): A number derived from the raw score for a domain that describes a student’s location on an achievement continuum or scale for the domain
Estimated Iowa Assessments Standard Score (eSS): A score range (upper and lower) derived from aligning the scale score (iSS-T) from the Interim Assessments ELA and Math test to the Standard Score (SS) of a student for an Iowa Assessments ELA Total or an Iowa Assessments Math score, respectively
Performance Band
(Optional) In the FROM and TO boxes, type the performance indicator value range to be applied to any or all of the color categories. Enter the low value in the FROM box and the high value in the TO box.
Note: You can change the performance band labels by typing different text in the label field for any or all of the color categories.
Score Filters
a. For the SCORE FILTERS field, click Change. The filter box appears with filter options available for the report. These options vary depending on the type of report.
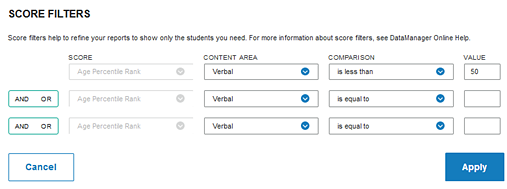
b. In the SCORE list, select the specific score type to use as a filter for the test results.
Note: Lexile is not available for filtering because it is represented by a range.
c. In the CONTENT AREA list, select one of the skill domains.
d. Select a relational operator (is equal to, is greater than, for example) from the COMPARISON list and type a VALUE in the box.
e. (Optional) Specify one or two additional filters by selecting AND or OR in the AND/OR list and repeating steps b - d.
Note: Selecting AND adds the additional filter requirement to the previous filter(s); the results contain only those values that meet both filter requirements. (For example: If your filter states “greater than 40 AND less than 50,” then the results include only values between 41 and 49.) Selecting OR includes the additional filter results together with the results of the previous filter(s); the results contain those values that meet either of the filter requirements. (For example: If your filter states “greater than 90 OR less than 10” on a scale of 0 to 99, then the results include values 91 to 99 and values 0 to 9.)
f. Click Apply to apply the filters to the report. To remove or cancel the filter(s), click Cancel.
Multimeasure Columns
After you have made selections for the fields on the first column of the Multimeasure Student Roster report, add a second column by clicking the + Add Column text, then enter criteria for that column. Repeat this process for up to 10 columns. As columns are added to the report, a series of up to 10 numbers (corresponding to the columns) appears in the upper left of the page, above the fields.
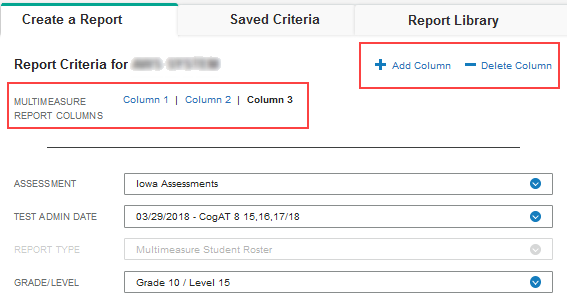
- To add another measure to the report, click the + Add Column link and select filters.
- To edit the report filters for one of the columns, click the column number and make the edits.
- To delete a column, select the column to be deleted and click - Delete Column.
Note: The Region, System, District, Building, and/or Class selections that you make in the first column apply to all the columns in the report.